import matplotlib.pyplot as plt
import numpy as np
from scipy import signal
from math import *
from scipy.interpolate import griddata
import math
npzfile = np.load("arduino_image.npz")
npzfile.files
Image = npzfile["Small"]
NbLines, LenLines = np.shape(Image)
#np.savez("arduino_image", Small=Small)
Image[4] = Image[5]
Image[167] = Image[168]
Raw = Image/25
OffSets = []
for l in range(NbLines):
    Corr = signal.correlate(Raw[0][0:250], Raw[l][0:250], mode='same')
    ACorr = np.argmax(Corr) #
    OffSets.append((ACorr))
OffMax = max(OffSets)
np.shape(Image)
(180, 2000)
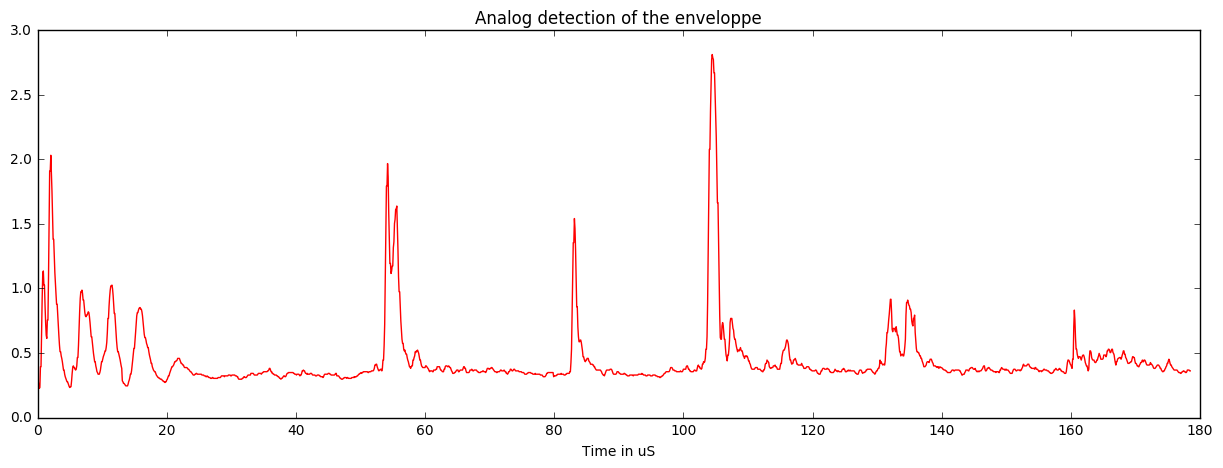
t = [x / 11.2 for x in range(len(Image[120]))]
plt.figure(figsize=(15,5))
plt.plot(t,Image[120]*3.3/512,"r")
plt.xlabel("Time in uS")
plt.title("Analog detection of the enveloppe")
plt.savefig('AnalogEnvelopSample.jpg', bbox_inches='tight')
plt.show()
Size
Without decimation, we have on line the right gabarit. We find that resolution is 14.93 px / mm. That's around 15px / mm.
The speed of sound is 1500m/s, so on the image we have 1.332us/mm.
- Acquisition speed is therefore 14.93/1.332 is 11.2Msps.
- The acquarium wall is at 100mm, that should be 1493px
Decimation = 3
DecSL = 2
NotCentered = 224
Corrected = np.zeros((NbLines, LenLines-OffMax+NotCentered))
RawImage = np.zeros((NbLines/Decimation, LenLines-OffMax+NotCentered))
NbLinesC, LenLinesC = np.shape(RawImage)
for i in range(NbLines):
for j in range(LenLines-OffMax):
Corrected [i][j+NotCentered] = Image[i][j-OffSets[i]+OffMax]
Corrected[97] = Corrected[96]
Corrected = Corrected-np.amin(Corrected)
#Corrected = np.sqrt(Corrected)
for j in range(NbLines/Decimation):
for k in range(Decimation):
RawImage [j] += Corrected[Decimation*j+k]
RawImg = np.zeros((NbLines/Decimation, (LenLines-OffMax)/DecSL))
for i in range(NbLines/Decimation):
for j in range((LenLines-OffMax)/DecSL):
for k in range(DecSL):
RawImg [i][j] += RawImage[i][DecSL*j+k]
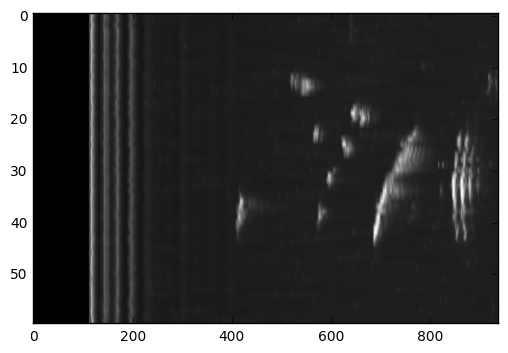
plt.imshow((RawImg),cmap=plt.get_cmap('gray'),aspect='auto',)
plt.show()
LenLinesC = (LenLines-OffMax)/DecSL
SC = np.zeros((LenLinesC,LenLinesC))
SC += 1
maxAngle = 60.0
step = maxAngle/(NbLinesC+1)
CosAngle = math.cos(math.radians(30))
Limit = LenLinesC*CosAngle
points = []
values = []
for i in range(LenLinesC):
for j in range(LenLinesC):
if ( (j > LenLinesC/2 + i/(2*CosAngle)) or (j < LenLinesC/2 - i/(2*CosAngle)) ):
SC[i][j] = 0
points.append([i,j])
values.append(0)
if ( (i > Limit) ):
if ( (i**2 + (j-LenLinesC/2) ** 2) > LenLinesC**2):
SC[i][j] = 0
points.append([i,j])
values.append(0)
for i in range(NbLinesC):
PointAngle = i*step-30
COS = math.cos(math.radians(PointAngle))
SIN = math.sin(math.radians(PointAngle))
for j in range(LenLinesC):
X = (int)( j*COS)
Y = (int)(LenLinesC/2 - j*SIN)
SC[X][Y] = RawImg[i][j]
points.append([X,Y])
values.append(RawImg[i][j])
values = np.array(values,dtype=np.int)
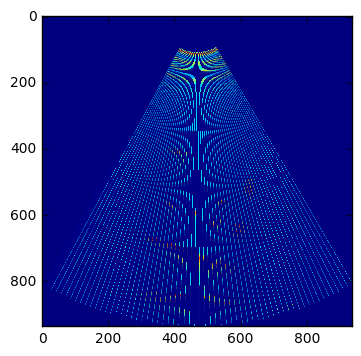
plt.imshow((SC) )
plt.show()
grid_x, grid_y = np.mgrid[0:(LenLines-OffMax)/DecSL:1, 0:(LenLines-OffMax)/DecSL:1]
#grid_z0 = griddata(points, values, (grid_x, grid_y), method='nearest')
grid_z1 = griddata(points, values, (grid_x, grid_y), method='linear')
#grid_z2 = griddata(points, values, (grid_x, grid_y), method='cubic')
LineNb = 120
mmVal = []
mmLbl = []
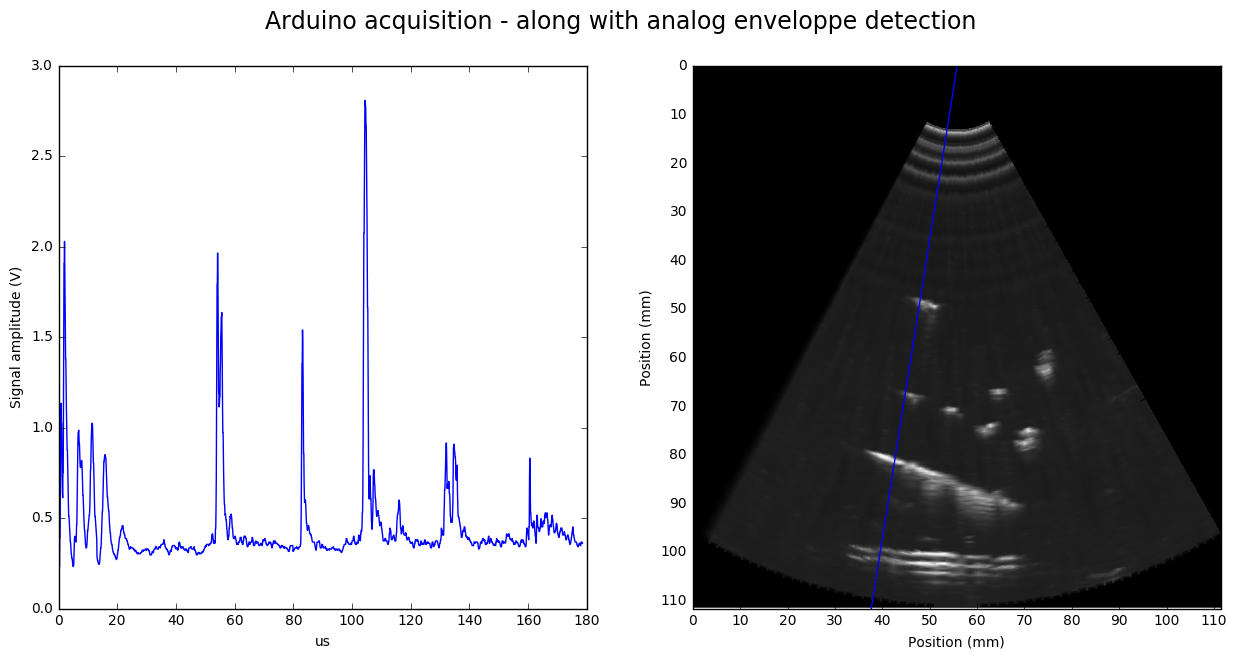
f, axarr = plt.subplots(1,2,figsize = (15,7))
f.suptitle("Arduino acquisition - along with analog enveloppe detection",fontsize = "17")
for k in range (np.shape(grid_z1)[1]):
if not(k%int(112*0.75)):
mmVal.append(k)
mmLbl.append(int(k/(11.2*0.75)))
plt.xticks(mmVal,mmLbl)
plt.yticks(mmVal,mmLbl)
axarr[1].set_xlabel("Position (mm)")
axarr[1].set_ylabel("Position (mm)")
axarr[1].imshow(grid_z1**2,cmap=plt.get_cmap('gray'),aspect="auto")
Angle = -LineNb*step/Decimation+30
Pos = math.sin(math.radians(Angle))
axarr[1].plot( [np.shape(grid_z1)[1]*(0.5), np.shape(grid_z1)[1]*(0.5+Pos)],[0,np.shape(grid_z1)[1]],'b')
axarr[0].set_xlabel("us")
axarr[0].set_ylabel("Signal amplitude (V)")
axarr[0].plot(t,Image[LineNb]*3.3/512,"b")
plt.savefig('EnveloppeLineEnveloppe.jpg', bbox_inches='tight')
plt.show()