ADC tests - 20180210a test of acquisition with a AD08200 ADC pHAT
Testing Hannes file with AD08200
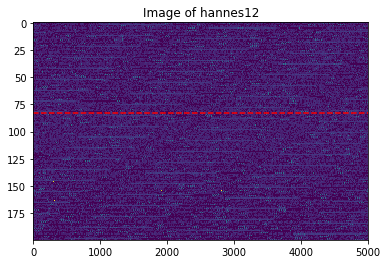
Looks like it works in some way. But we don't see anything on the image. Perhaps something wrong with the gain setting?
this is for fast batch processing, generates images in less than a second... We will soon have realtime imaging
import matplotlib.pyplot as plt
import numpy as np
from scipy import signal
#from scipy.signal import decimate, convolve
#import math
#from scipy.interpolate import griddata
import copy
#from DAT2NPZ import *
#import glob, os
def fast_image(filename):
Bytes = np.fromfile(filename+".dat", dtype = '<i4')
bytes = Bytes[:-1]
#ADC2_GPIO = [7, 8,9,10,11,23,24,25]
#we want to have the bits from 7 to 8 and 23 to 25, so lets do som bit shifting magic...
sbytes = copy.deepcopy(bytes)
sbytes = np.right_shift(bytes,7) #so remove right bits below 7
sbytes = np.bitwise_and(sbytes,31)
bbytes = copy.deepcopy(bytes)
bbytes = np.right_shift(bbytes,18) #so remove right bits below 7
bbytes = np.bitwise_and(bbytes,511)
mbytes = sbytes+bbytes
#et voila
M = mbytes
#get sample frequency, duration and the time
n = len(bytes)
Duration = Bytes[-1]
Fech = n*1.0/(Duration*1e-9)/1e6 # 1e-9 because Duration is in ns, 1e6 because Fech in Msps
print "Duration:",Duration
print "Fech:",Fech
t = range(n)
for k in range(n):
t[k] = 1.0*t[k]/Fech
print t[:10]
rawSig = M
#rawSig = M - np.average(M)
print len(rawSig)
T = t
print T[:10]
sample_size = 5000 #sample size
repeat_size = len(rawSig)/sample_size #repeat size
FH = rawSig
#reshape envelope of the signal
tableData = np.sqrt(np.asarray(FH).reshape((repeat_size,sample_size)))
IndexEmpty = 20 #where does this number come from?
IndexLine = 83 #where does this number come from?
ExLine = tableData[IndexLine]
ExLineRaw = tableData[IndexLine]
plt.figure(figsize=(15,5))
#plt.plot(T[0:4000],rawSig[5000*IndexLine:5000*IndexLine+4000],"y", label='Raw signal')
#plt.plot(T[0:3000],F[5000*IndexLine:5000*IndexLine+3000],"r", label='Filtered signal')
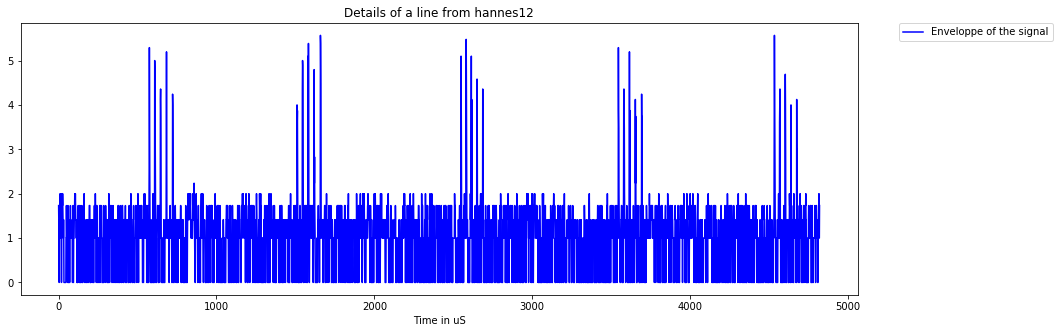
plt.plot(T[0:4000],ExLine[0:4000],"b", label='Enveloppe of the signal')
print len(T[0:3000])
print len(ExLine[0:3000])
#the dimensions are not matching. guess theres something wrong with the dimensions of tableData
plt.title("Details of a line from "+filename.split("/")[-1])
plt.xlabel("Time in uS")
plt.legend(bbox_to_anchor=(1.05, 1), loc=2, borderaxespad=0.)
plt.savefig('Imgs/ProcessingLine_'+filename.split("/")[-1]+".png", bbox_inches='tight')
plt.show()
#add an offset to the image, will do that later
#get average value
Val = np.average(tableData)
#tableData = np.asarray(FH).reshape((1000,2*2500))
Offset = 0
MinTable = 10*np.min(tableData)
Zeroes = np.zeros((repeat_size,Offset))+Val
BigTable = []
BigTable = np.append(Zeroes, tableData, axis=1)
#plot the reshaped data
#there are some dots, so guess the file contains data
plt.imshow((abs(BigTable)), aspect='auto')
plt.title("Image of "+filename.split("/")[-1])
plt.axhline(IndexLine, color='r', linestyle='--')
#plt.title("Mapping the data from "+RawData.split("/")[-1]+" .")
plt.savefig('Imgs/map_'+filename.split("/")[-1]+".png", bbox_inches='tight')
plt.show()
fast_image("hannes12")
Duration: 1205242116
Fech: 0.829708808483
[0.0, 1.205242116, 2.4104842319999999, 3.6157263479999999, 4.8209684639999999, 6.0262105799999999, 7.2314526959999998, 8.4366948119999989, 9.6419369279999998, 10.847179043999999]
1000000
[0.0, 1.205242116, 2.4104842319999999, 3.6157263479999999, 4.8209684639999999, 6.0262105799999999, 7.2314526959999998, 8.4366948119999989, 9.6419369279999998, 10.847179043999999]
3000
3000