import mpl_toolkits
mpl_toolkits.__path__.append('/usr/lib/python2.7/dist-packages/mpl_toolkits/')
from mpl_toolkits.basemap import Basemap
import matplotlib.pyplot as plt
import numpy as np
import os
from glob import glob
def GetContri(path):
    results = [y for x in os.walk(path) for y in glob(os.path.join(x[0], 'Readme.md'))]
    Name = []
    Pos = []
    lon = []
    lat = []
    for eachContri in results:
        with open(eachContri) as FileContent:
            for line in FileContent:
                if line.startswith( 'pos: ' ):
                    Coordon = line.replace('pos: ',"").strip()
                    Pos.append(Coordon)
                    X = float(Coordon.split(",")[0])
                    Y = float(Coordon.split(",")[1])
                    lon.append(X)
                    lat.append(Y)
                if line.startswith( 'who: ' ):
                    Name.append(line.replace('who: ',"").strip())
    return Name,Pos,lon,lat
Contrib = GetContri("./")
NbContrib = np.shape(Contrib)[1]
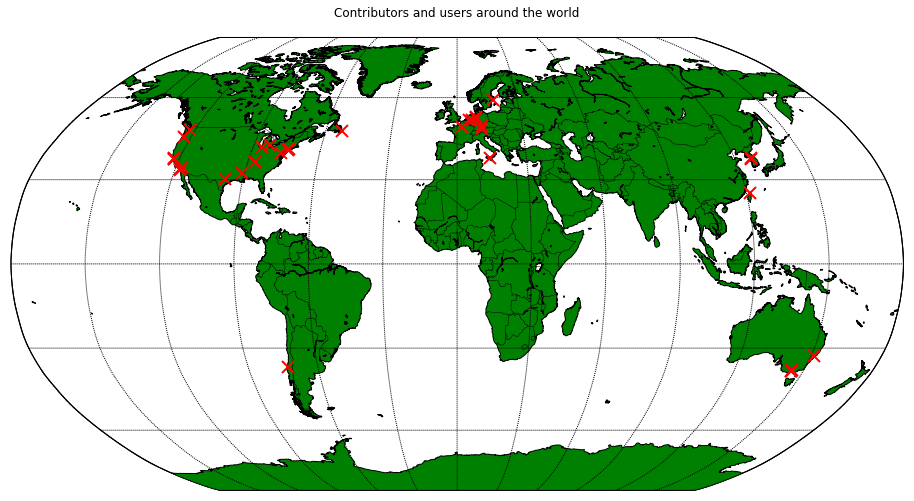
plt.figure(figsize=(16,12))
eq_map = Basemap(projection='robin', resolution = 'l', area_thresh = 1000.0,
lat_0=0, lon_0=0)
eq_map.drawcoastlines()
eq_map.drawcountries()
eq_map.fillcontinents(color = 'green')
eq_map.drawmapboundary()
eq_map.drawmeridians(np.arange(0, 360, 30))
eq_map.drawparallels(np.arange(-90, 90, 30))
for k in range(NbContrib):
x,y = eq_map(Contrib[3][k], Contrib[2][k])
eq_map.plot(x, y, 'rx', markersize=12,mew=2)
title_string = "Contributors and users around the world\n"
plt.title(title_string)
plt.savefig("map.jpg", bbox_inches='tight')
plt.show()
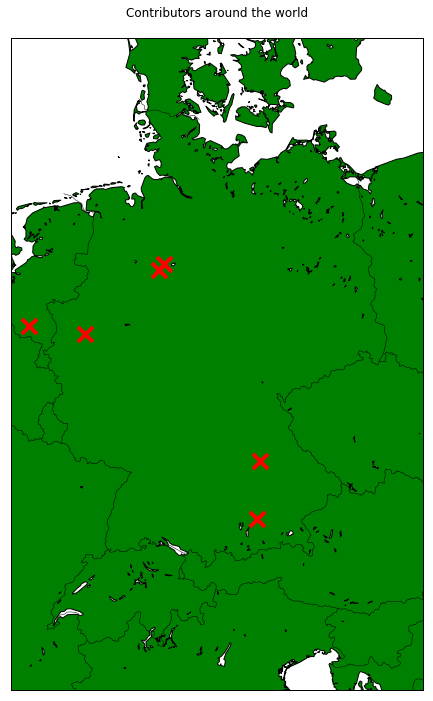
plt.figure(figsize=(16,12))
eq_map = Basemap(projection='merc', resolution = 'i',area_thresh = 1,
llcrnrlat=45.0,
llcrnrlon=5.0,
urcrnrlat=56.0,
urcrnrlon=16)
eq_map.drawcoastlines()
eq_map.drawcountries()
eq_map.fillcontinents(color = 'green')
eq_map.drawmapboundary()
for k in range(NbContrib):
x,y = eq_map(Contrib[3][k], Contrib[2][k])
eq_map.plot(x, y, 'rx', markersize=15,mew=4)
title_string = "Contributors around the world\n"
plt.title(title_string)
plt.savefig("germany.jpg", bbox_inches='tight')
plt.show()
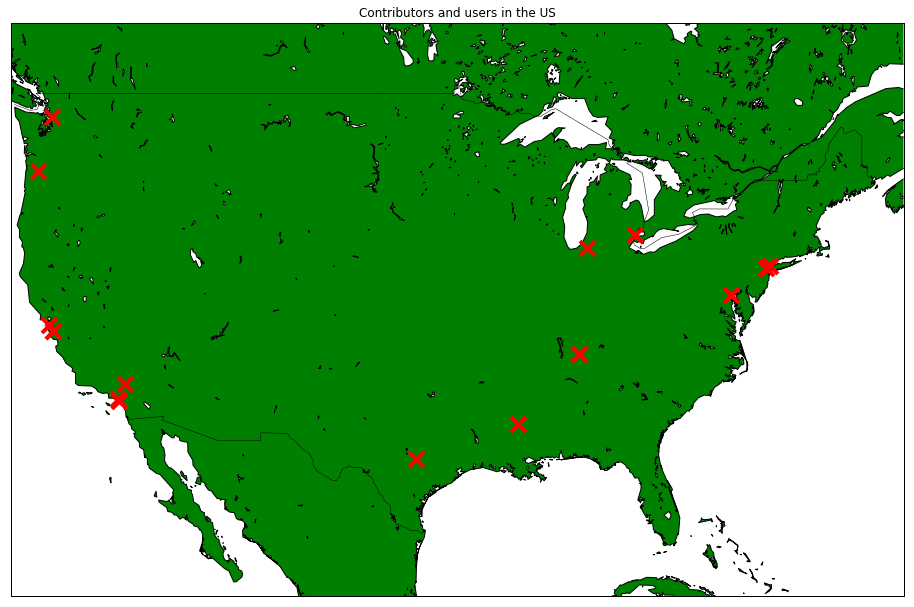
plt.figure(figsize=(16,12))
Lt = 37
Lo = -95
LtE = 15
LoE = 30
eq_map = Basemap(projection='merc', resolution = 'l',area_thresh = 10,
llcrnrlat=Lt-LtE,
llcrnrlon=Lo-LoE,
urcrnrlat=Lt+LtE,
urcrnrlon=Lo+LoE)
eq_map.drawcoastlines()
eq_map.drawcountries()
eq_map.fillcontinents(color = 'green')
eq_map.drawmapboundary()
for k in range(NbContrib):
x,y = eq_map(Contrib[3][k], Contrib[2][k])
eq_map.plot(x, y, 'rx', markersize=15,mew=4)
title_string = "Contributors and users in the US"
plt.title(title_string)
plt.savefig("us.jpg", bbox_inches='tight')
plt.show()
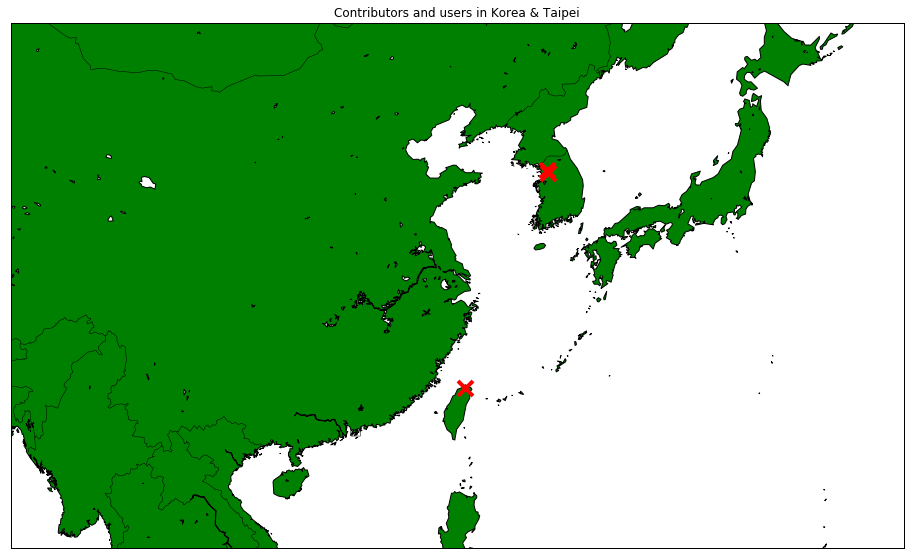
plt.figure(figsize=(16,12))
Lt = 30
Lo = 121
LtE = 15
LoE = 30
eq_map = Basemap(projection='merc', resolution = 'l',area_thresh = 10,
llcrnrlat=Lt-LtE,
llcrnrlon=Lo-LoE,
urcrnrlat=Lt+LtE,
urcrnrlon=Lo+LoE)
eq_map.drawcoastlines()
eq_map.drawcountries()
eq_map.fillcontinents(color = 'green')
eq_map.drawmapboundary()
for k in range(NbContrib):
x,y = eq_map(Contrib[3][k], Contrib[2][k])
eq_map.plot(x, y, 'rx', markersize=15,mew=4)
title_string = "Contributors and users in Korea & Taipei"
plt.title(title_string)
plt.savefig("asia.jpg", bbox_inches='tight')
plt.show()