20180620a - Testing pulser and ADC
# Basic math
import math
import os
# Signal processing
import numpy as np
import matplotlib.pyplot as plt
from scipy.signal import hilbert, chirp
# Custom lib
import ustk as USTk # Ultrasound toolkit
Preparing the data
Let's unpack what has been acquired by the ADC pHAT.
for filename in os.listdir("./data/"):
    if filename.endswith(".DAT"):
        DATFile = os.path.join("", filename).split(".")[0]
        if not os.path.isfile(DATFile+".npz"):
            print DATFile+".DAT"
            Arf = USTk.CreateUsPack(DATFile+".DAT")
20180620a.DAT
20180620a.DAT
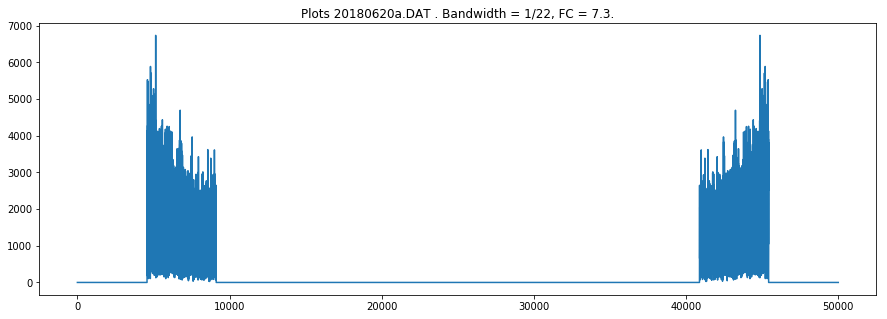


Working on a specific file
FullLength = len(rawSignal)
print "There are ",FullLength/5000,"lines in the file of 5000 pts."
There are 10 lines in the file of 5000 pts.
DATFile = "20180620a"
DATA = np.load(DATFile+".npz")
DATA.keys()
Image, rawSignal = DATA['arr_1'], DATA['arr_0']
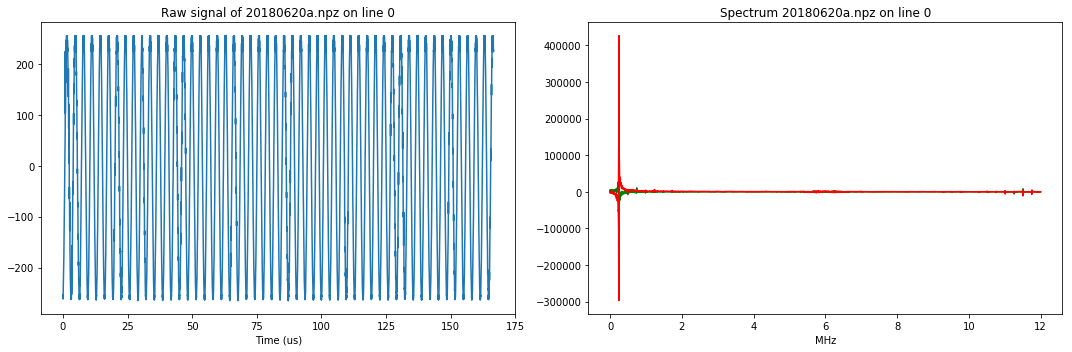
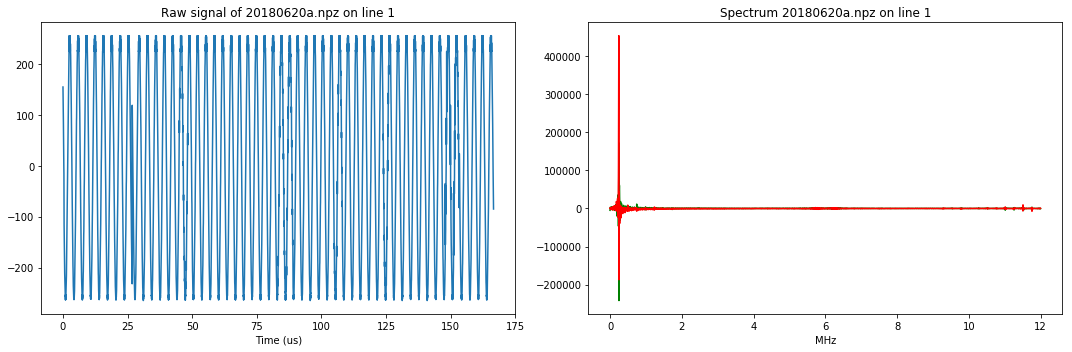
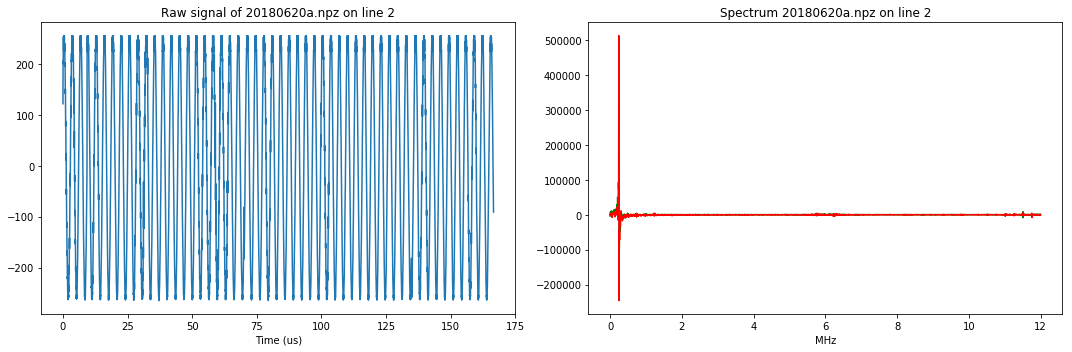
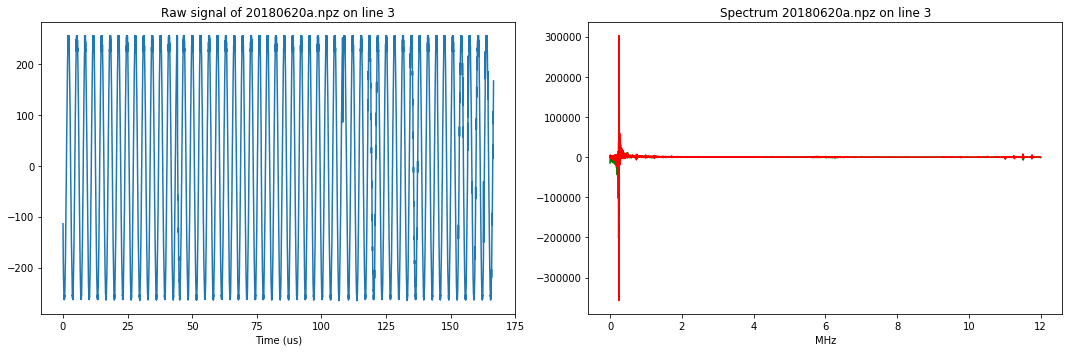
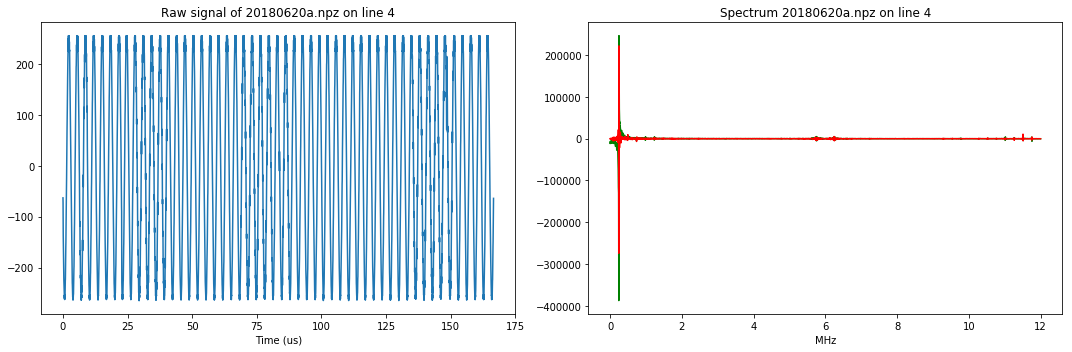
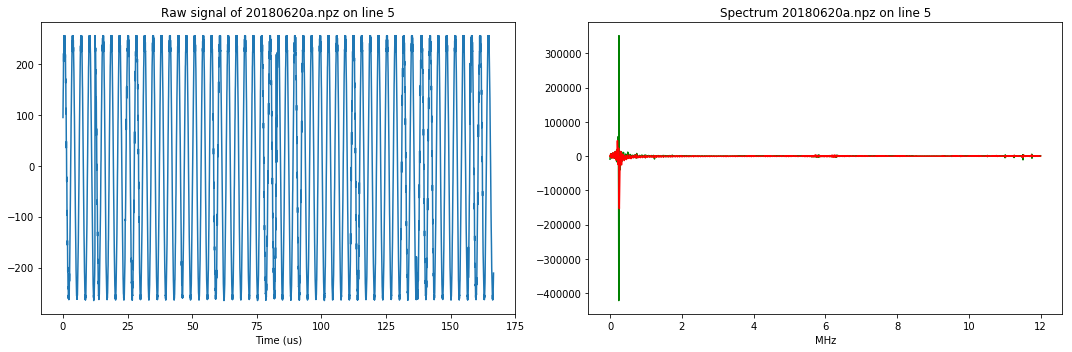
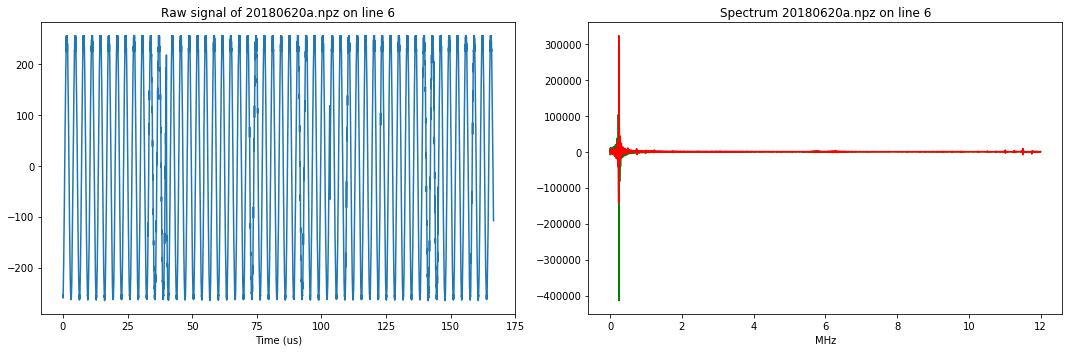
for N in range(FullLength):
plt.figure(figsize=(15,5))
line = rawSignal[N*5000:(N+1)*5000]
F = 12 # acquisition speed in MHz
plt.subplot(1, 2, 1)
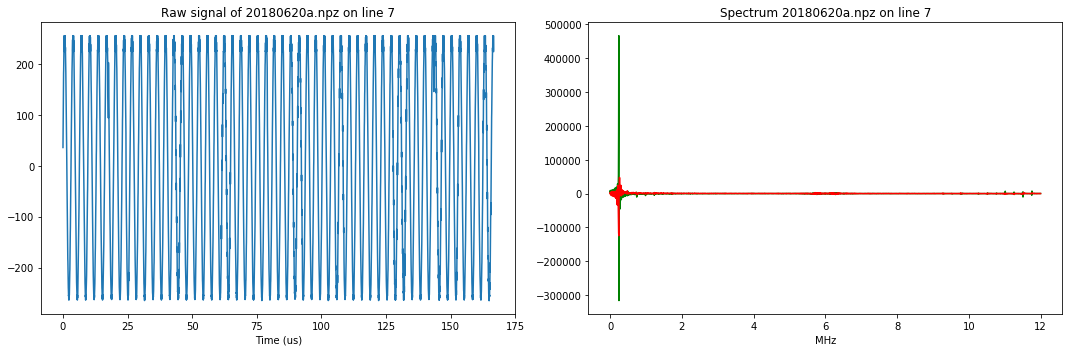
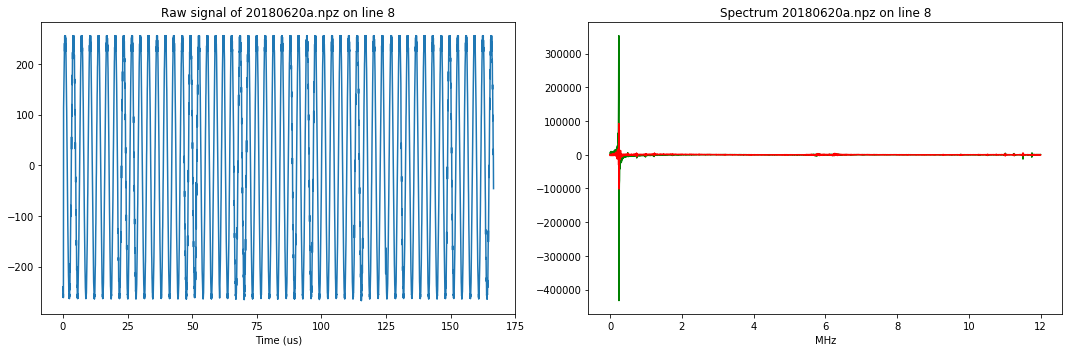
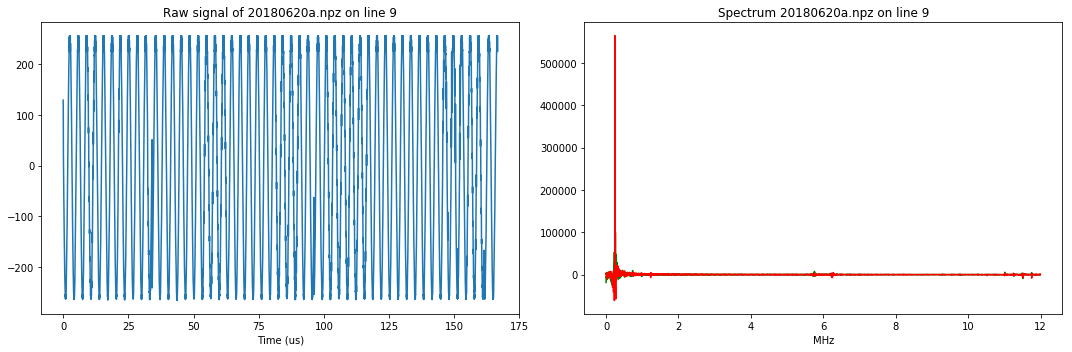
plt.title("Raw signal of "+DATFile+".npz on line "+str(N))
ff = [ 2*x*1000.0/(F*len(line)) for x in range(len(line))]
plt.plot(ff,line)
plt.xlabel("Time (us)")
plt.subplot(1, 2, 2)
plt.title("Spectrum "+DATFile+".npz on line "+str(N))
fftline = np.fft.fft(line)
ff = [ 12*2.0*x/(len(line)) for x in range(len(line))]
plt.plot(ff[0:len(line)/2],np.real(fftline)[0:len(line)/2],"g")
plt.plot(ff[0:len(line)/2],np.imag(fftline)[0:len(line)/2],"r")
plt.xlabel("MHz")
plt.tight_layout()
plt.savefig("lines/"+DATFile+"_line"+str(N)+"sample.jpg", bbox_inches='tight')
plt.show()
---------------------------------------------------------------------------

ValueError                                Traceback (most recent call last)

<ipython-input-13-e92c20365350> in <module>()
     12     plt.subplot(1, 2, 2)
     13     plt.title("Spectrum "+DATFile+".npz on line "+str(N))
---> 14     fftline = np.fft.fft(line)
     15     ff = [ 12*2.0*x/(len(line)) for x in range(len(line))]
     16     plt.plot(ff[0:len(line)/2],np.real(fftline)[0:len(line)/2],"g")


/usr/local/lib/python2.7/dist-packages/numpy/fft/fftpack.pyc in fft(a, n, axis, norm)
    190     if n is None:
    191         n = a.shape[axis]
--> 192     output = _raw_fft(a, n, axis, fftpack.cffti, fftpack.cfftf, _fft_cache)
    193     if _unitary(norm):
    194         output *= 1 / sqrt(n)


/usr/local/lib/python2.7/dist-packages/numpy/fft/fftpack.pyc in _raw_fft(a, n, axis, init_function, work_function, fft_cache)
     54     if n < 1:
     55         raise ValueError("Invalid number of FFT data points (%d) specified."
---> 56                          % n)
     57
     58     # We have to ensure that only a single thread can access a wsave array


ValueError: Invalid number of FFT data points (0) specified.
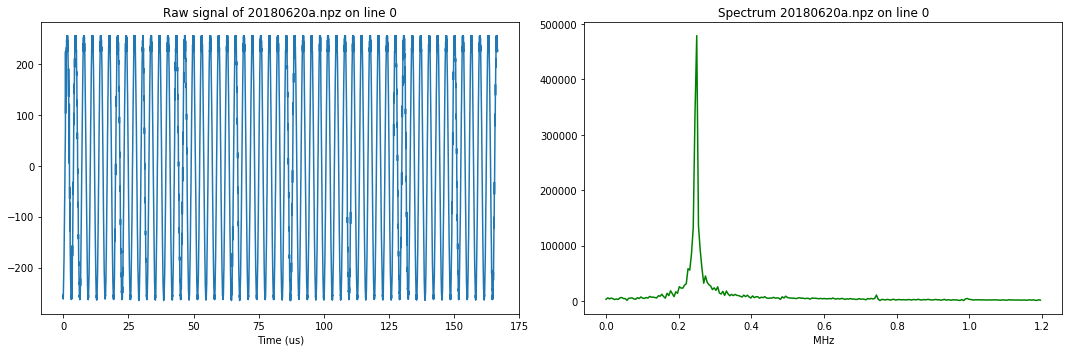
Doing line 0
N = 0
line = rawSignal[N*5000:(N+1)*5000]
F = 12 # acquisition speed in MHz
plt.figure(figsize=(15,5))
plt.subplot(1, 2, 1)
plt.title("Raw signal of "+DATFile+".npz on line "+str(N))
ff = [ 2*x*1000.0/(F*len(line)) for x in range(len(line))]

plt.plot(ff,line)
plt.xlabel("Time (us)")

plt.subplot(1, 2, 2)
plt.title("Spectrum "+DATFile+".npz on line "+str(N))
fftline = np.fft.fft(line)
ff = [ 12*2.0*x/(len(line)) for x in range(len(line))]
plt.plot(ff[0:len(line)/20],np.abs(fftline)[0:len(line)/20],"g")
#plt.plot(ff[0:len(line)/20],np.imag(fftline)[0:len(line)/20],"r")
plt.xlabel("MHz")

plt.tight_layout()
plt.savefig("lines/"+DATFile+"_line"+str(N)+"details.jpg", bbox_inches='tight')
plt.show()