Testing new boards 20180216a
Objective
The objective of this experiment is to test both the new bipolar pulser and the new ADC pHAT.
- Series are in the form ZXY where X is the position of the pulser green jumper (on pic below), and Y the yellow jumper, and Z is the series (here A, and B).
- Series A are with the new pulser (macrofab, alt.tbo v2)
- Series B with the old (ChinaCo, alt.tbo v1).
Processing to be done through a jupyter notebook, images stored in a repo, and raw data in another. Pulser code on RPi side is available too.
Images autotagged.
Setup
Results
Overview
Still one issue with the pulser: half the pulses don't go
Same issue with the ChinaCo board (alt.tbo v1)
In details
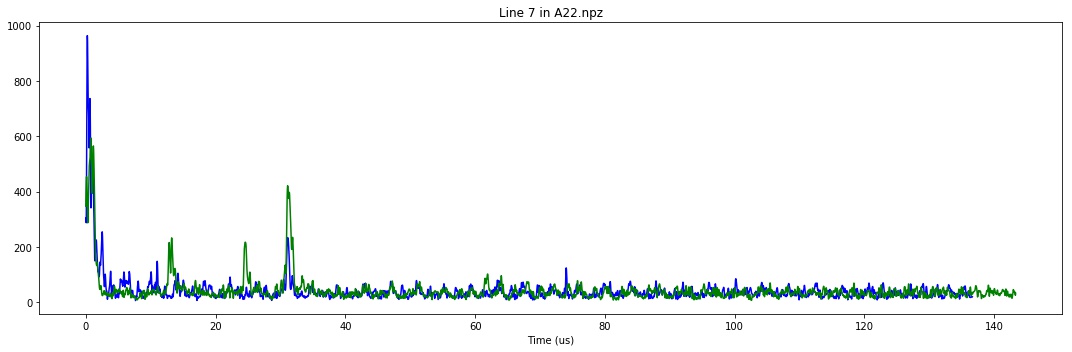
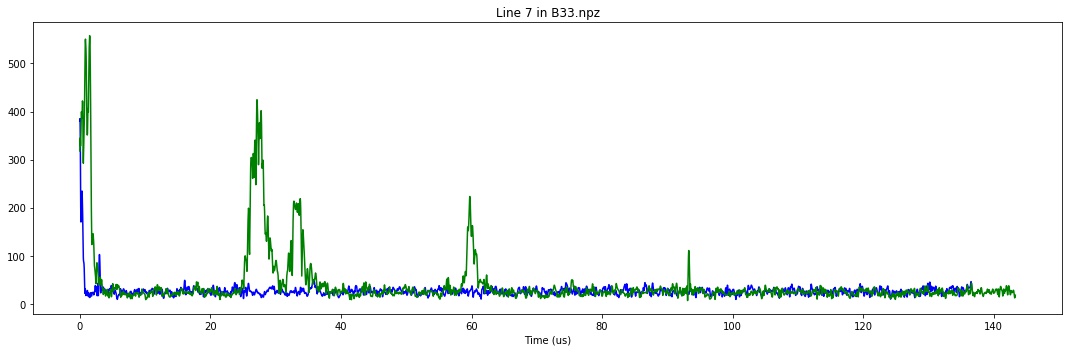
Nice echo from even lines
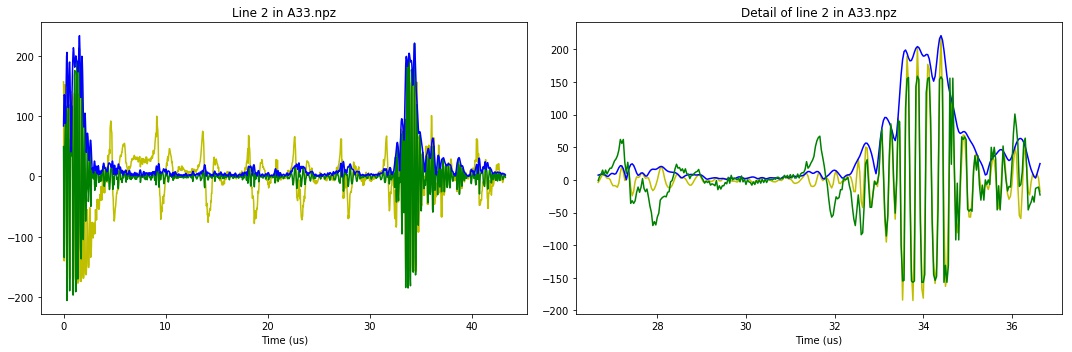
Nothing on odd lines
Same with ChinaCo
Pulser issues ?
Graph

@todo .. it seems it trigs when logic signal is going low... strange, isn't it ?

Pinout
- Pulse_B: Track_10: IO - PPuls_ON
- Pulse_A: Track_9: IO - NPuls_ON
- Damper: Track_15: GPIO21 - Puls_OFF
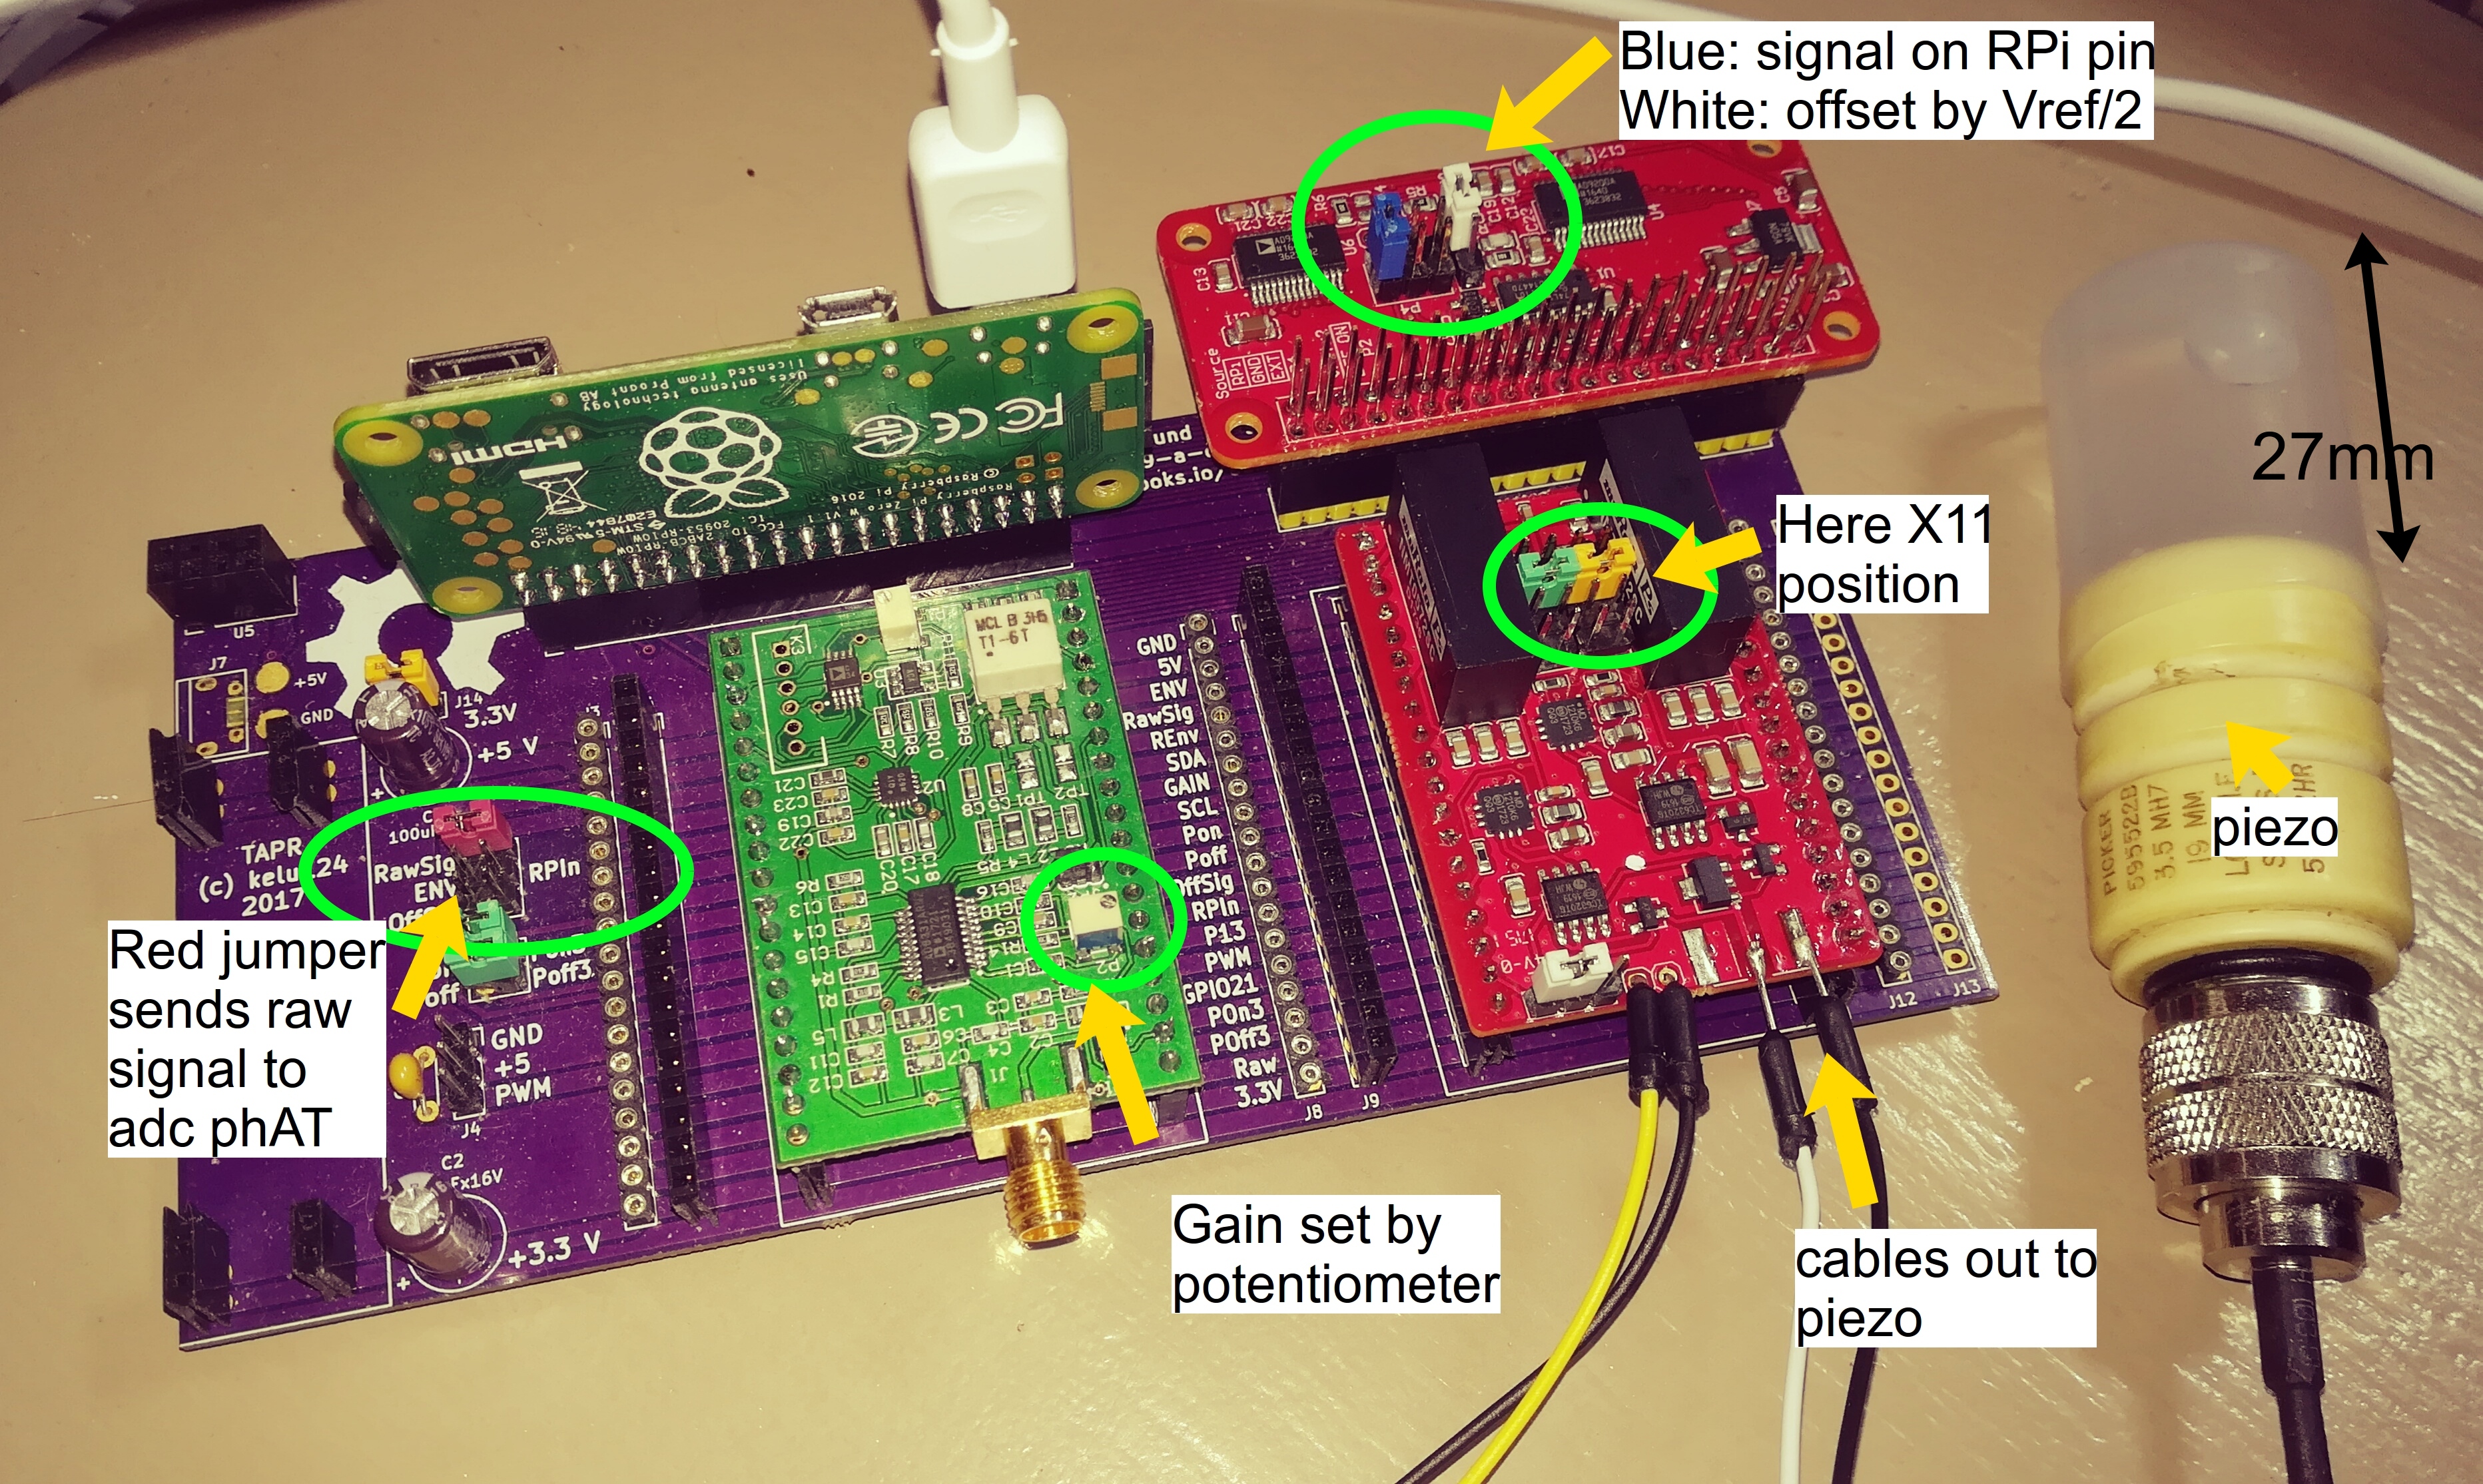
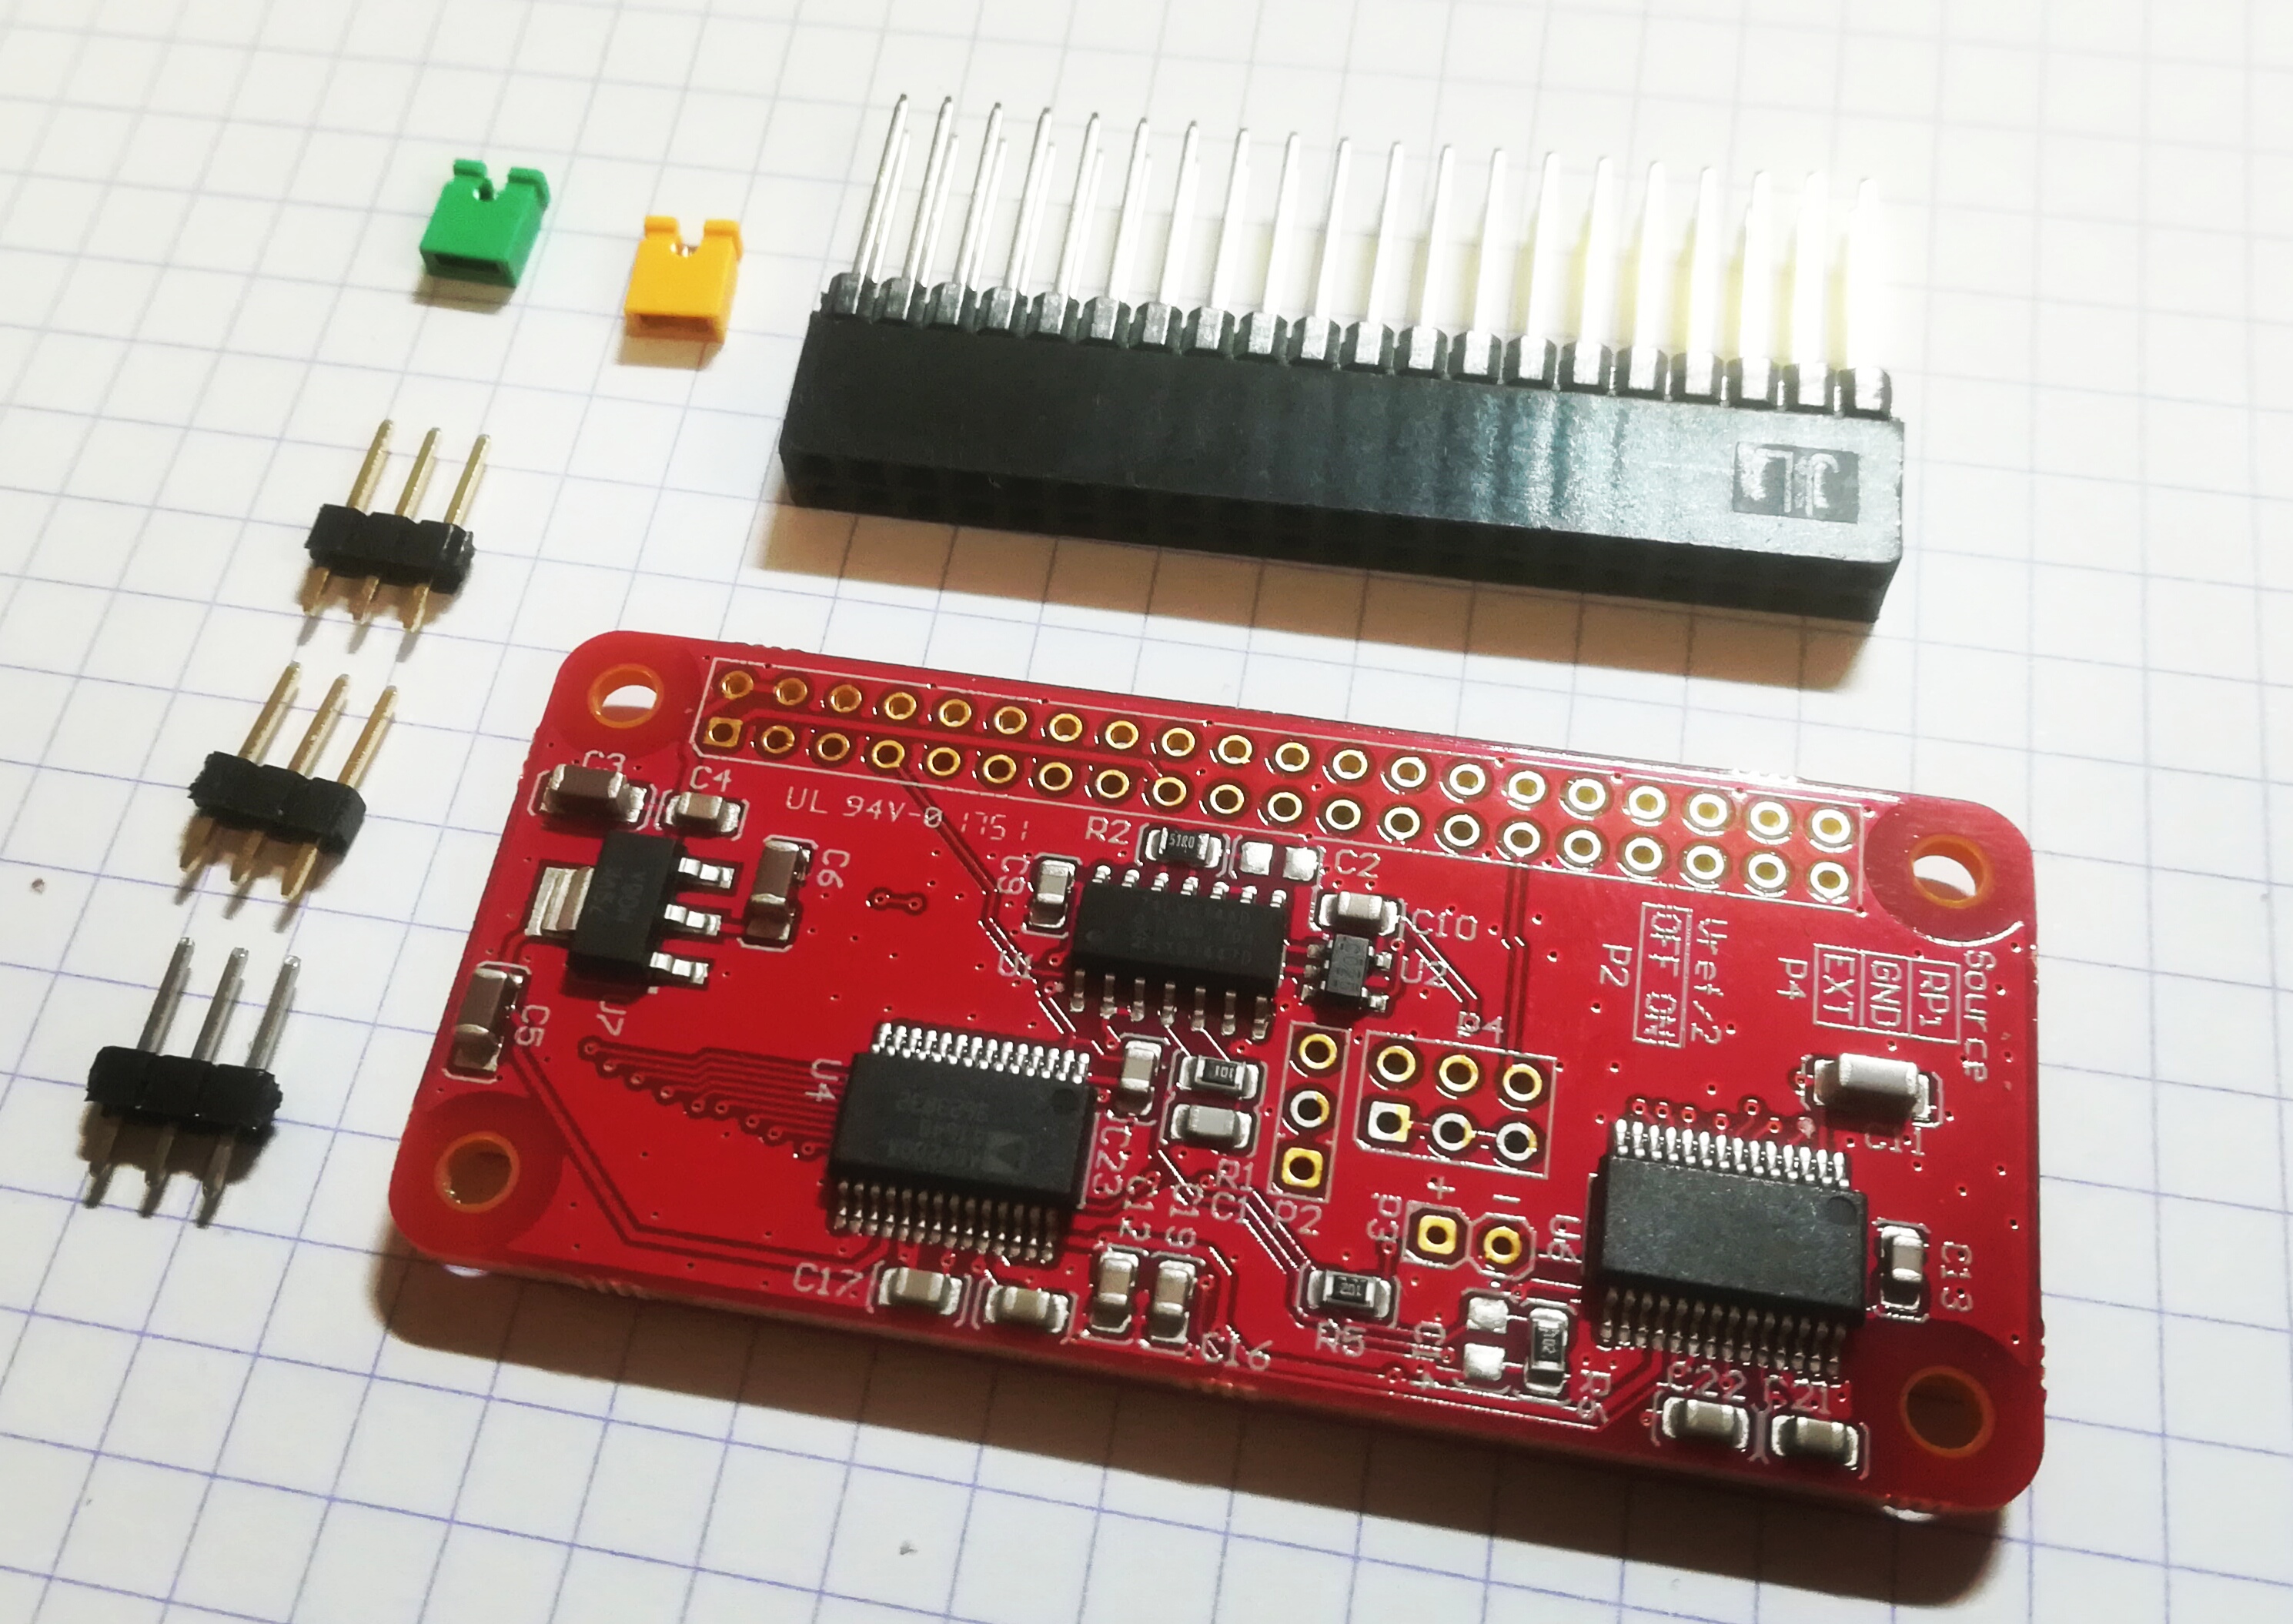
Boards before mounted
Pulser (alt.tbo v2)
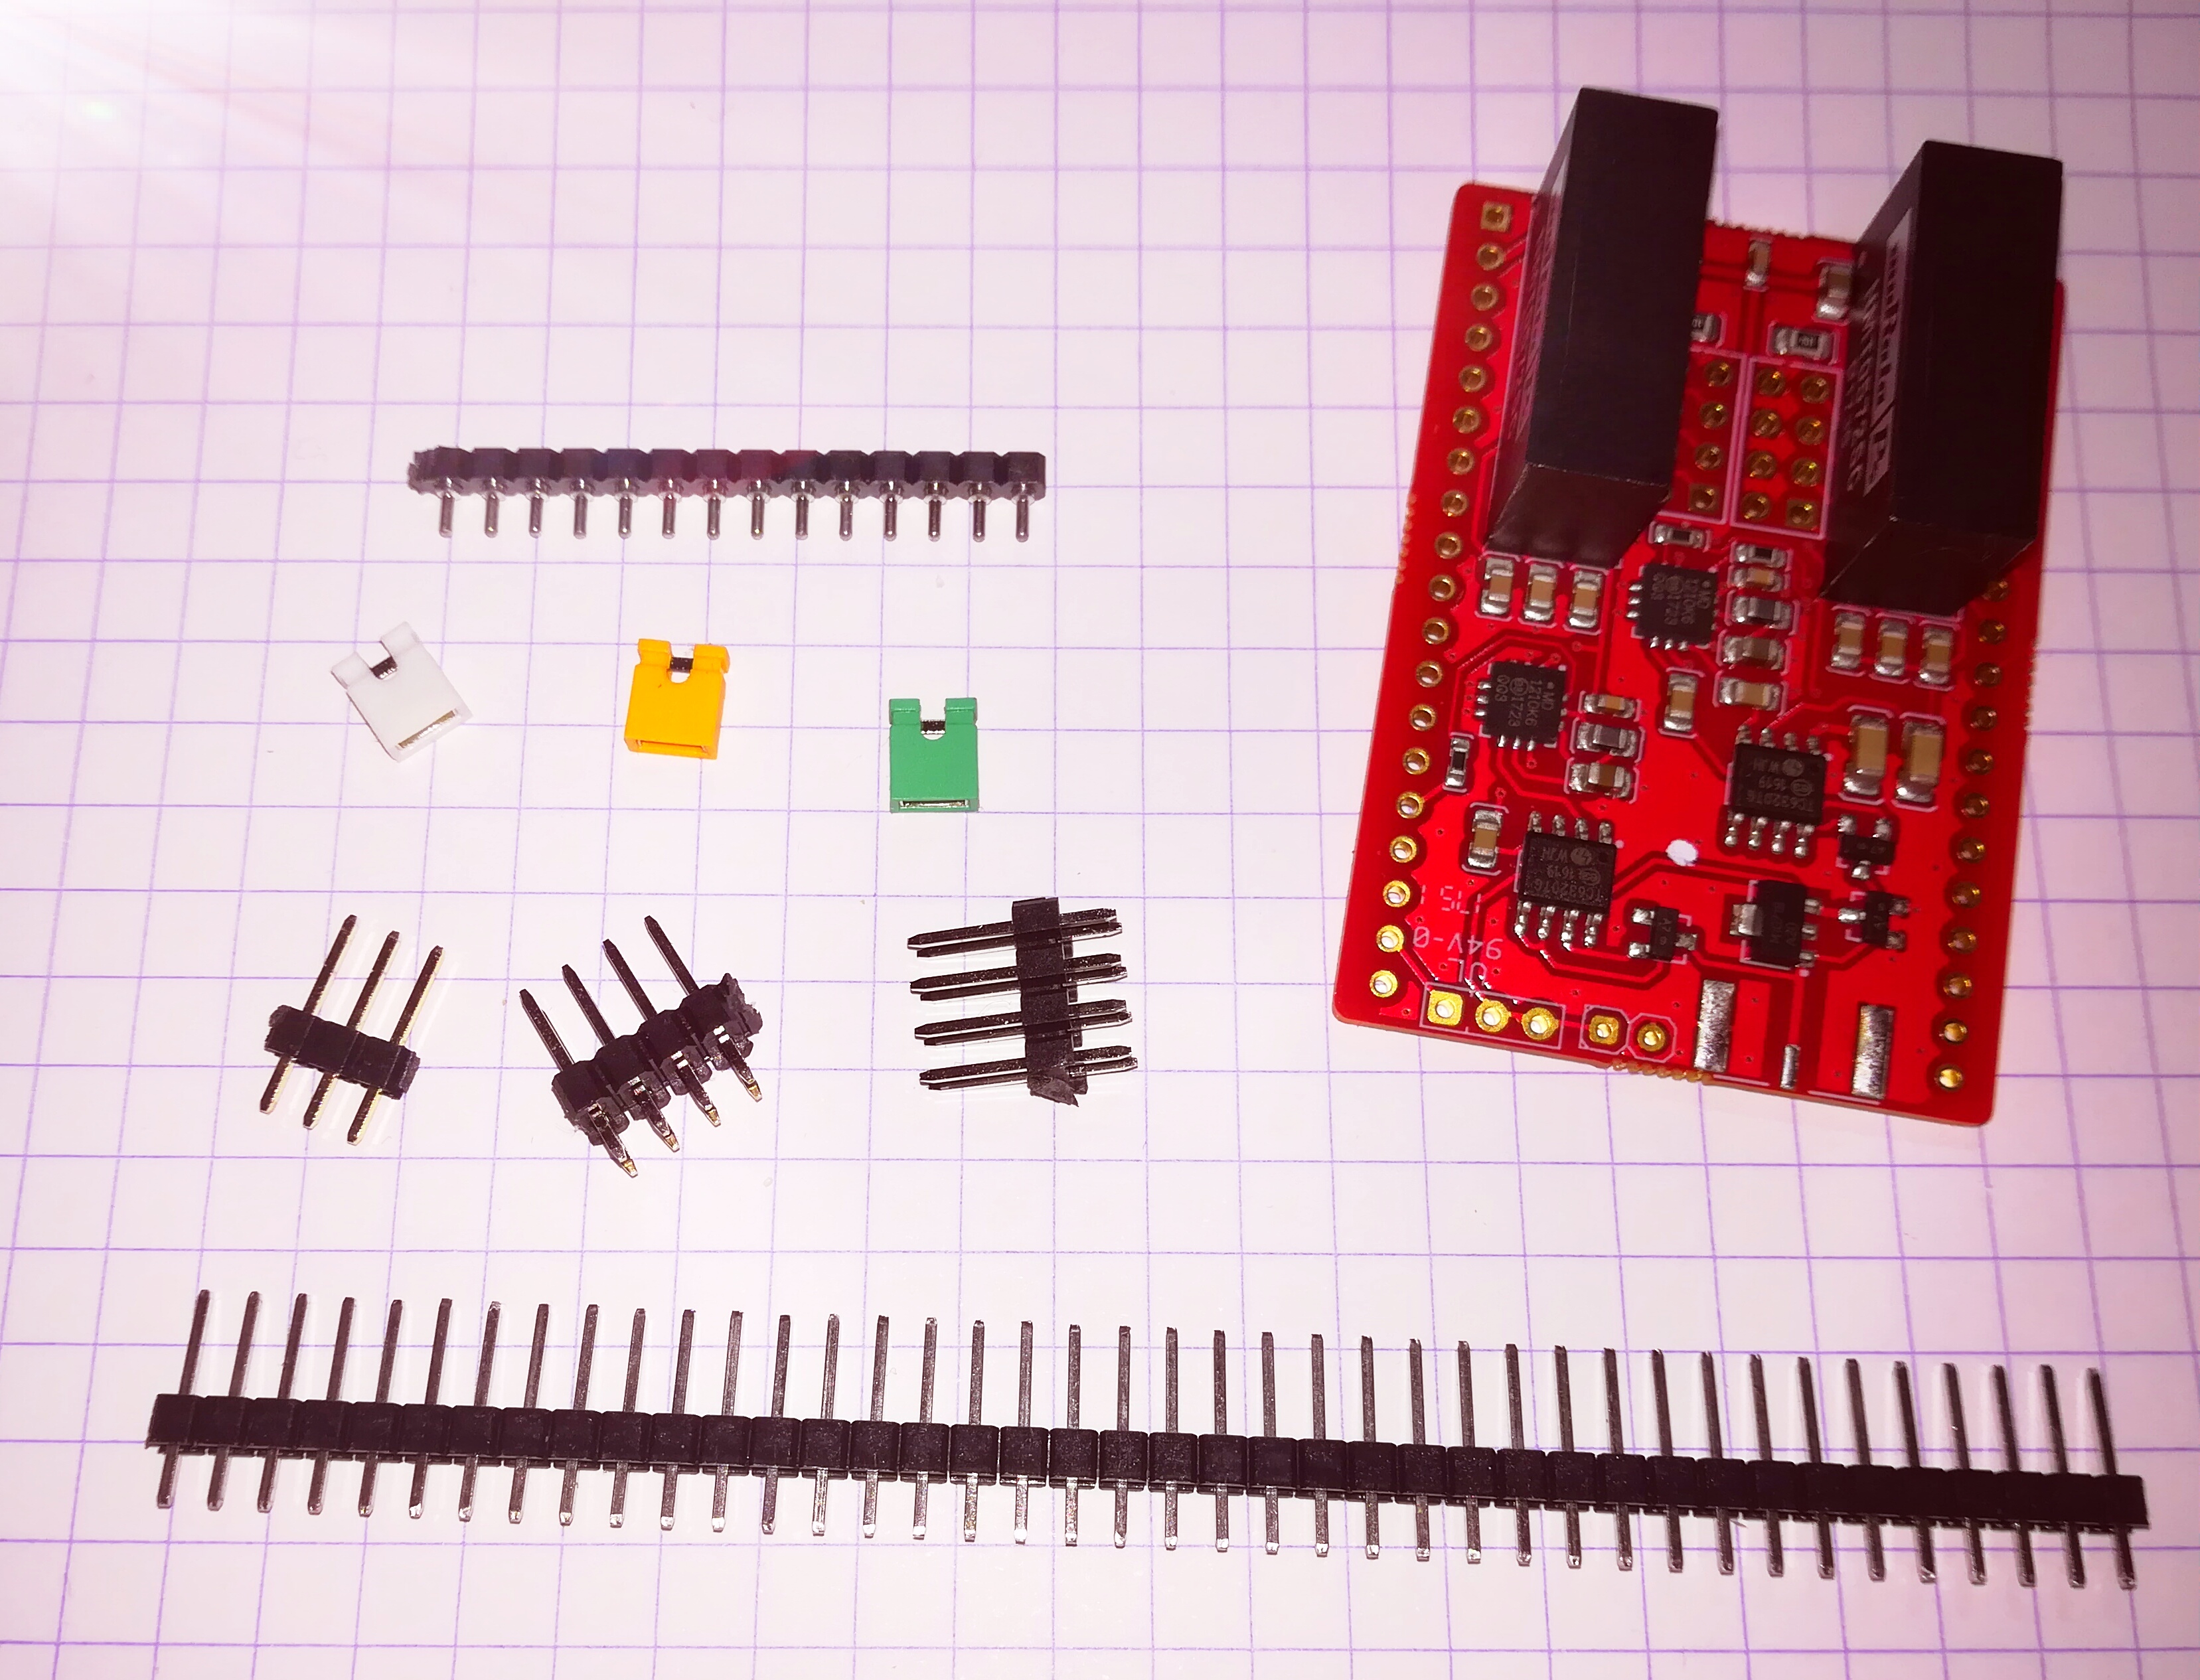
ADC pHAT (elmo v2)
Automated list of supporting files for the experiment 20180216a
List of files
md
jupyter
python
Modules
Images of the Experiment
Setup
Setting up the 20180216a experiment
Setting up the 20180216a experiment

Setting up the 20180216a experiment
Raw images
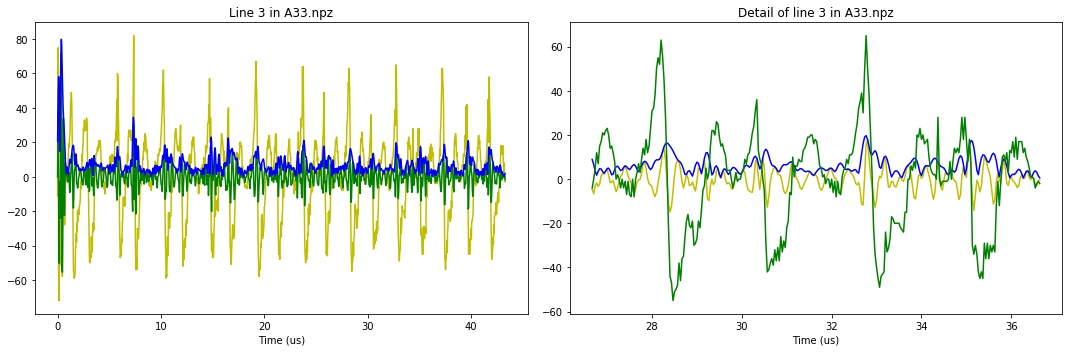
Cleaned line from the 20180216a experiment
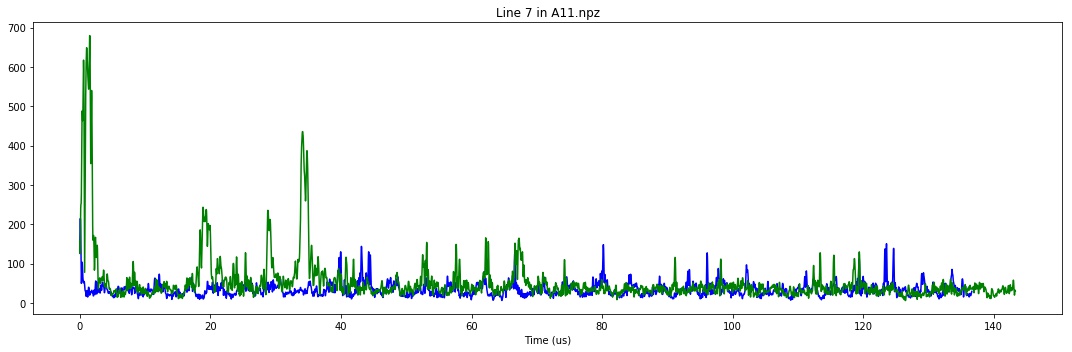
Raw line from the 20180216a experiment
Cleaned line from the 20180216a experiment
Cleaned line from the 20180216a experiment
Raw line from the 20180216a experiment
Cleaned line from the 20180216a experiment

Raw line from the 20180216a experiment
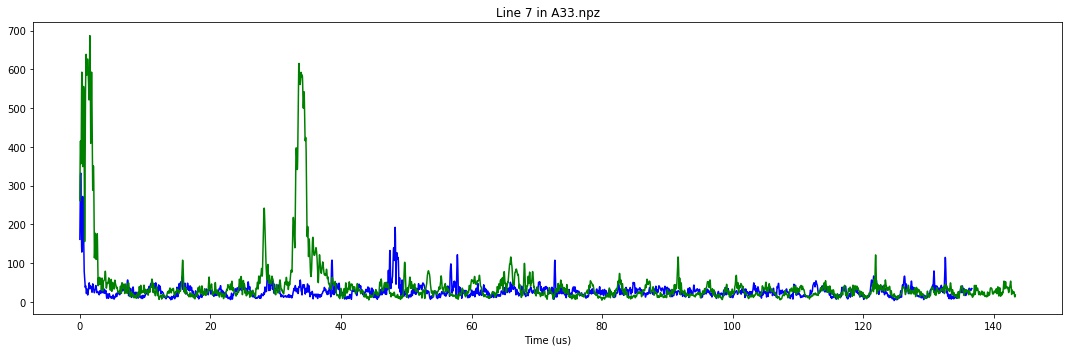
Cleaned line from the 20180216a experiment
Cleaned line from the 20180216a experiment

Cleaned line from the 20180216a experiment
Others

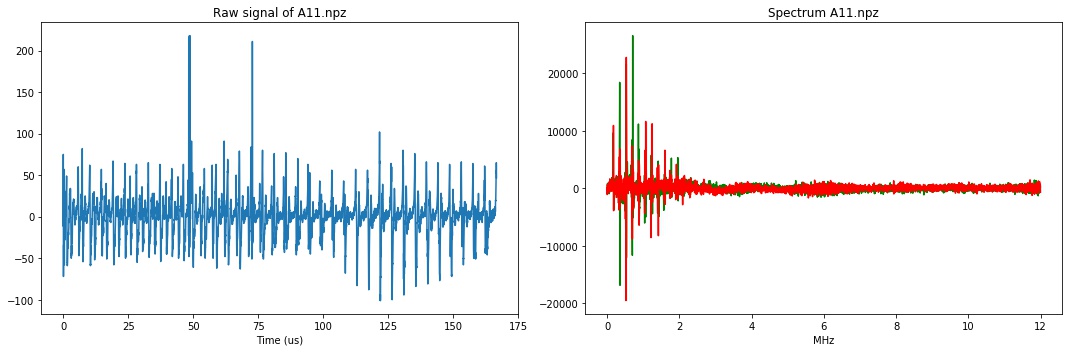
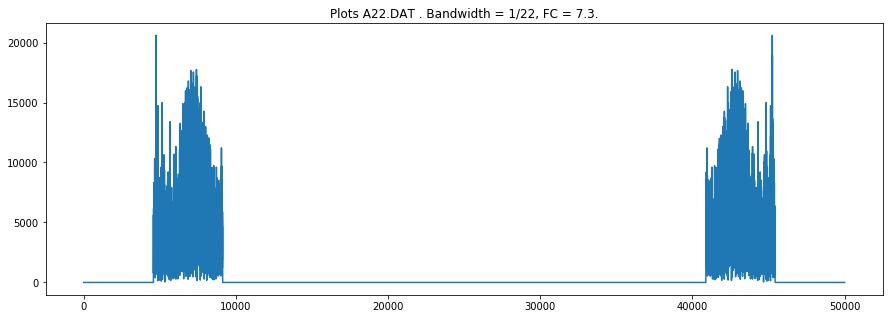
Map of the DATA file from the 20180216a experiment (category: graph).
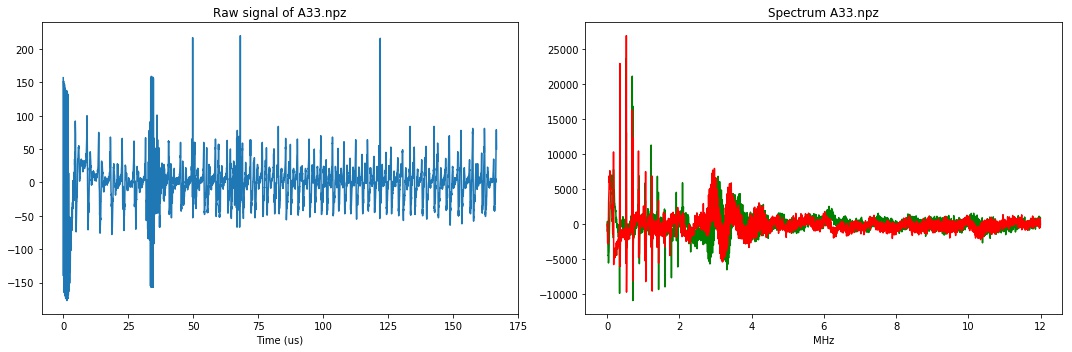
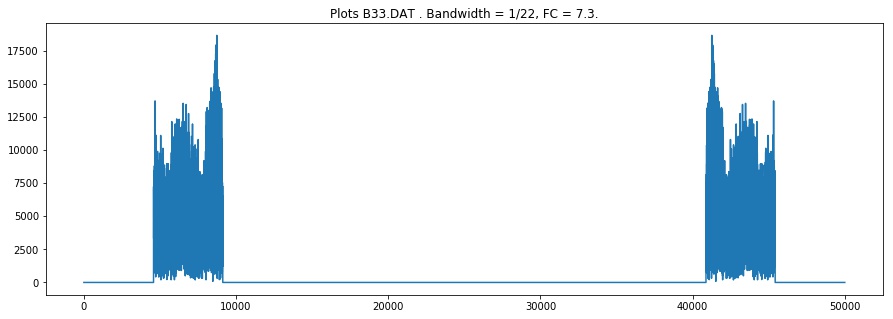
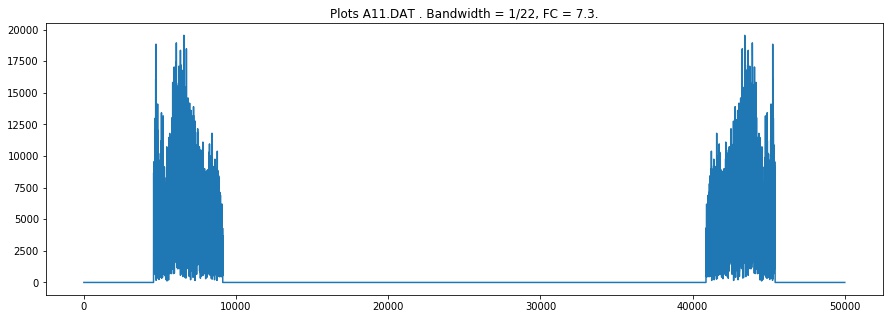
Spectrum of the DATA file from the 20180216a experiment (category: graph).

Map of the DATA file from the 20180216a experiment (category: graph).
Spectrum of the DATA file from the 20180216a experiment (category: graph).

Map of the DATA file from the 20180216a experiment (category: graph).
Spectrum of the DATA file from the 20180216a experiment (category: graph).

Map of the DATA file from the 20180216a experiment (category: graph).

Spectrum of the DATA file from the 20180216a experiment (category: graph).