Testing DAC - 20180310a xlabel(txt)
import matplotlib.pyplot as plt
import matplotlib.image as image
Deb = 100
Fin = 1000
n = 200/5
DAClValues = []
for k in range(n+1):
val = int(Deb+1.0*k*(Fin-Deb)/n)
DAClValues.append(val)
print DAClValues,len(DAClValues)
[100, 122, 145, 167, 190, 212, 235, 257, 280, 302, 325, 347, 370, 392, 415, 437, 460, 482, 505, 527, 550, 572, 595, 617, 640, 662, 685, 707, 730, 752, 775, 797, 820, 842, 865, 887, 910, 932, 955, 977, 1000] 41
DACeValues = []
t = []
for k in range(n+1):
    val = (Fin-Deb)*k**3/n**3+Deb
    t.append(5*k)
    DACeValues.append(val/1000.0)
print DACeValues,len(DACeValues)
[0.1, 0.1, 0.1, 0.1, 0.1, 0.101, 0.103, 0.104, 0.107, 0.11, 0.114, 0.118, 0.124, 0.13, 0.138, 0.147, 0.157, 0.169, 0.182, 0.196, 0.212, 0.23, 0.249, 0.271, 0.294, 0.319, 0.347, 0.376, 0.408, 0.442, 0.479, 0.518, 0.56, 0.605, 0.652, 0.702, 0.756, 0.812, 0.871, 0.934, 1.0] 41
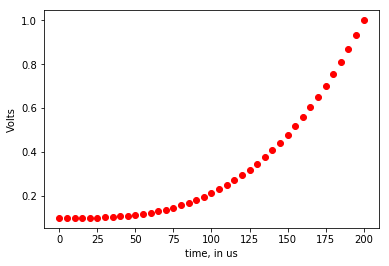
plt.plot(t,DACeValues,"ro")
plt.ylabel("Volts")
plt.xlabel("time, in us")
plt.savefig("./gain.jpg")
plt.show()
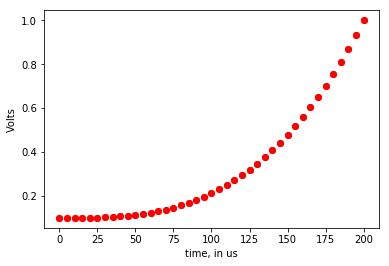
plt.plot(t,DACeValues,"ro")
plt.ylabel("Volts")
plt.xlabel("time, in us")
plt.savefig("./gain.jpg")
plt.show()
for i in range(len(DACeValues)):
    if (DACeValues[i] >= 0) and (DACeValues[i] < 1020):
        print 16+i,DACeValues[i]*1000
16 100.0
17 100.0
18 100.0
19 100.0
20 100.0
21 101.0
22 103.0
23 104.0
24 107.0
25 110.0
26 114.0
27 118.0
28 124.0
29 130.0
30 138.0
31 147.0
32 157.0
33 169.0
34 182.0
35 196.0
36 212.0
37 230.0
38 249.0
39 271.0
40 294.0
41 319.0
42 347.0
43 376.0
44 408.0
45 442.0
46 479.0
47 518.0
48 560.0
49 605.0
50 652.0
51 702.0
52 756.0
53 812.0
54 871.0
55 934.0
56 1000.0
plt.plot(t,DACeValues,"ro")
plt.ylabel("Volts")
plt.xlabel("time, in us")
plt.savefig("./gain.jpg")
plt.show()
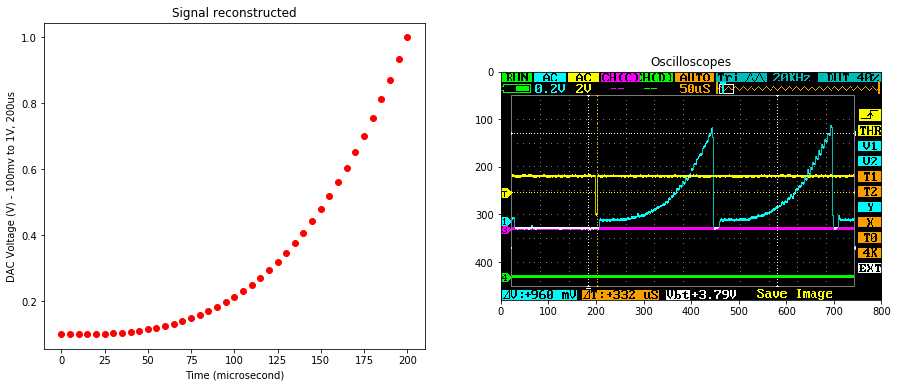
im = image.imread('DAC/IMAG001.png')
plt.figure(figsize=(15,6))
plt.subplots_adjust(hspace=.5)
plt.subplot(122)
plt.imshow(im)
plt.title("Oscilloscopes")
plt.subplot(121)
plt.plot(t,DACeValues,"ro")
plt.title("Signal reconstructed")
plt.ylabel("DAC Voltage (V) - 100mv to 1V, 200us")
plt.xlabel("Time (microsecond)")
plt.savefig("./curve.jpg")
plt.show()