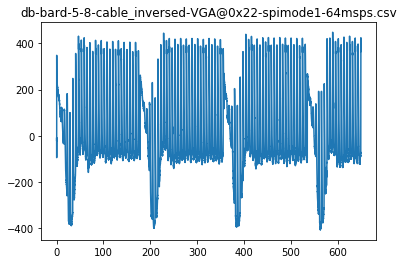
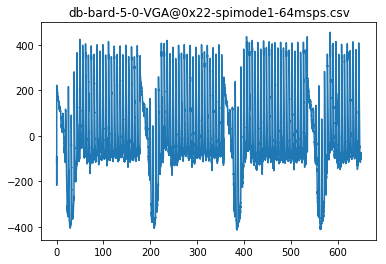
20180317a Testing the new versions at 32 and 64Msps with Probe
import numpy as np
import matplotlib.pyplot as plt
from scipy import signal
from scipy.interpolate import griddata
import math
from scipy.signal import decimate, convolve

import re
import glob, os
Creating the set of acquisitions
AA = []
lbl = []
IDLine = []
for CSVFile in glob.glob("db-b*.csv"):
print CSVFile
A = np.genfromtxt(CSVFile, delimiter=';').astype(int)[1:]
tmp = []
N = len(A)
FF = CSVFile.split(".")[0].split("-")[-1]
lbl.append( CSVFile.split("-")[2] )
f = int(re.sub('[^0-9]','', FF))
if (A[4]) < 0b111:
print "first"
for i in range(len(A)/2-1):
value = 128*(A[2*i+1]&0b111) + A[2*i+2] - 512
IDLine.append((A[2*i+1]&0b11110000)/16)
tmp.append( value )
else:
print "second"
for i in range(len(A)/2-1):
value = 128*(A[2*i+1]&0b111) + A[2*i+2] - 512
IDLine.append((A[2*i+1]&0b11110000)/16)
tmp.append( value )
t = [ 1.0*x/f for x in range(len(tmp))]
plt.plot(t,tmp)
plt.title(CSVFile)
plt.savefig(CSVFile.split(".")[0].split("/")[-1]+".jpg")
plt.show()
AA.append(tmp)
[email protected]
second

[email protected]
second

n = len(AA)
print n
len(AA[n-1])
5


20798
k = 1
L = len(AA[0])
f = 64.0
Signal = AA[0][0:L/5]
Signal2 = AA[1][0:L/5]
t = [ 1.0*x/f for x in range(L)]
print len(Signal),len(t)
plt.figure(figsize=(15,5))
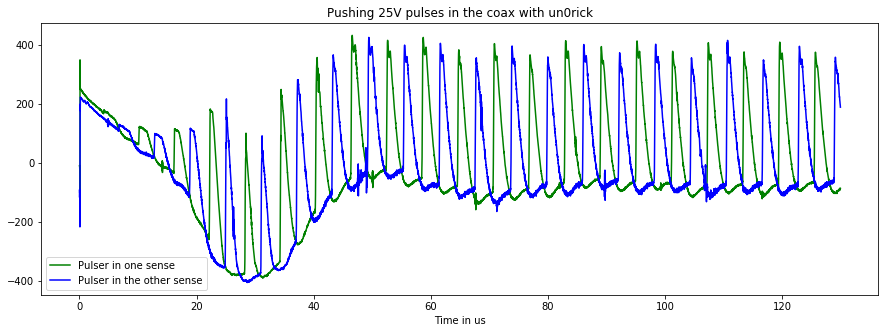
plt.title("Pushing 25V pulses in the coax with un0rick")
plt.plot(t[0:L/5],Signal,"g",label="Pulser in one sense")
plt.plot(t[0:L/5],Signal2,"b",label="Pulser in the other sense")
plt.xlabel("Time in us")
plt.legend()
plt.savefig("bard.jpg")
plt.show()
8319 41598

for i in range(2):
    print glob.glob("db-b*.csv")[i]
[email protected]
[email protected]


