20180227a Testing the new versions at 32 and 64Msps
import numpy as np
import matplotlib.pyplot as plt
from scipy import signal
from scipy.interpolate import griddata
import math
from scipy.signal import decimate, convolve

import re
import glob, os
Creating the set of acquisitions
AA = []
lbl = []
IDLine = []
for CSVFile in glob.glob("*.csv"):
print CSVFile
A = np.genfromtxt(CSVFile, delimiter=';').astype(int)[1:]
tmp = []
N = len(A)
FF = CSVFile.split(".")[0].split("-")[-1]
lbl.append( CSVFile.split("-")[2] )
f = int(re.sub('[^0-9]','', FF))
if (A[4]) > 0b111:
print "first"
for i in range(len(A)/2-1):
value = 128*(A[2*i+0]&0b111) + A[2*i+1] - 512
IDLine.append((A[2*i+1]&0b11110000)/16)
tmp.append( value )
else:
print "second"
for i in range(len(A)/2-1):
value = 128*(A[2*i+1]&0b111) + A[2*i+2] - 512
IDLine.append((A[2*i+1]&0b11110000)/16)
tmp.append( value )
t = [ 1.0*x/f for x in range(len(tmp))]
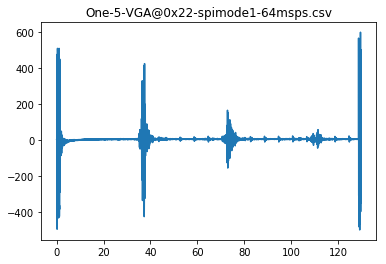
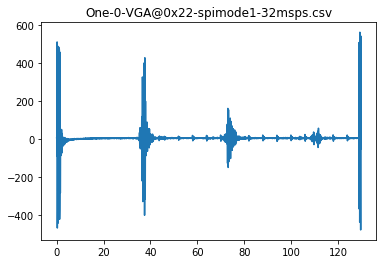
plt.plot(t,tmp)
plt.title(CSVFile)
plt.savefig(CSVFile.split(".")[0].split("/")[-1]+".jpg")
plt.show()
AA.append(tmp)
One-5-VGA@0x22-spimode1-64msps.csv
first
One-0-VGA@0x22-spimode1-32msps.csv
second
t1 = [ 1.0*x/32 for x in range(len(tmp))]
t2 = [ 1.0*x/64 for x in range(len(tmp))]
s1 = AA[-1]
s2 = AA[0]
fLegend = [ 64.0*x/len(s2) for x in range(len(s2))]
fm = len(fLegend)/2
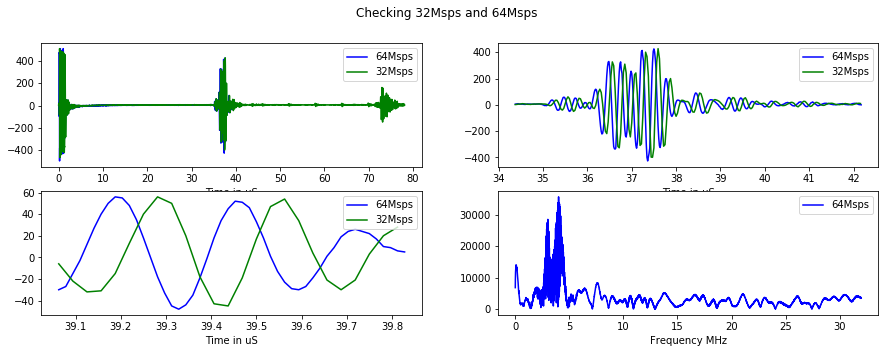
f, ((ax1, ax2), (ax3, ax4)) = plt.subplots(2, 2, figsize=(15,5))
ax1.plot(t2[0:2500],s2[0:2500],"b",label="64Msps")
ax1.plot(t1[0:2500],s1[0:2500],"g",label="32Msps")
ax1.set_xlabel("Time in uS")
ax2.plot(t2[2*1100:2*1350],s2[2*1100:2*1350],"b",label="64Msps")
ax2.plot(t1[1100:1350],s1[1100:1350],"g",label="32Msps")
ax2.legend()
ax2.set_xlabel("Time in uS")
ax1.set_xlabel("Time in uS")
ax1.legend()
ax3.plot(t2[2*1250:2*1275],s2[2*1250:2*1275],"b",label="64Msps")
ax3.plot(t1[1250:1275],s1[1250:1275],"g",label="32Msps")
ax3.legend()
ax3.set_xlabel("Time in uS")
ax4.plot(fLegend[1:fm], np.abs(np.fft.fft(s2))[1:fm] ,"b",label="64Msps")
ax4.legend()
ax4.set_xlabel("Frequency MHz")
plt.suptitle('Checking 32Msps and 64Msps')
plt.savefig("32_64.jpg", bbox_inches='tight')
plt.show()