Testing new boards 20180217a
Objective
The objective of this experiment is to test the software issues with the kernel module.
- Series are in the form ZXY where X is the position of the pulser green jumper (on pic below), and Y the yellow jumper, and Z is the series (here A, and B).
- Series A are with the new pulser (macrofab, alt.tbo v2)
- Series B with the old (ChinaCo, alt.tbo v1).
Processing to be done through a jupyter notebook, images stored in a repo, and raw data in another. Pulser code on RPi side is available too where pulses are driven by going low on control pins, and the other pulser code does the opposite.
Images autotagged.
Setup
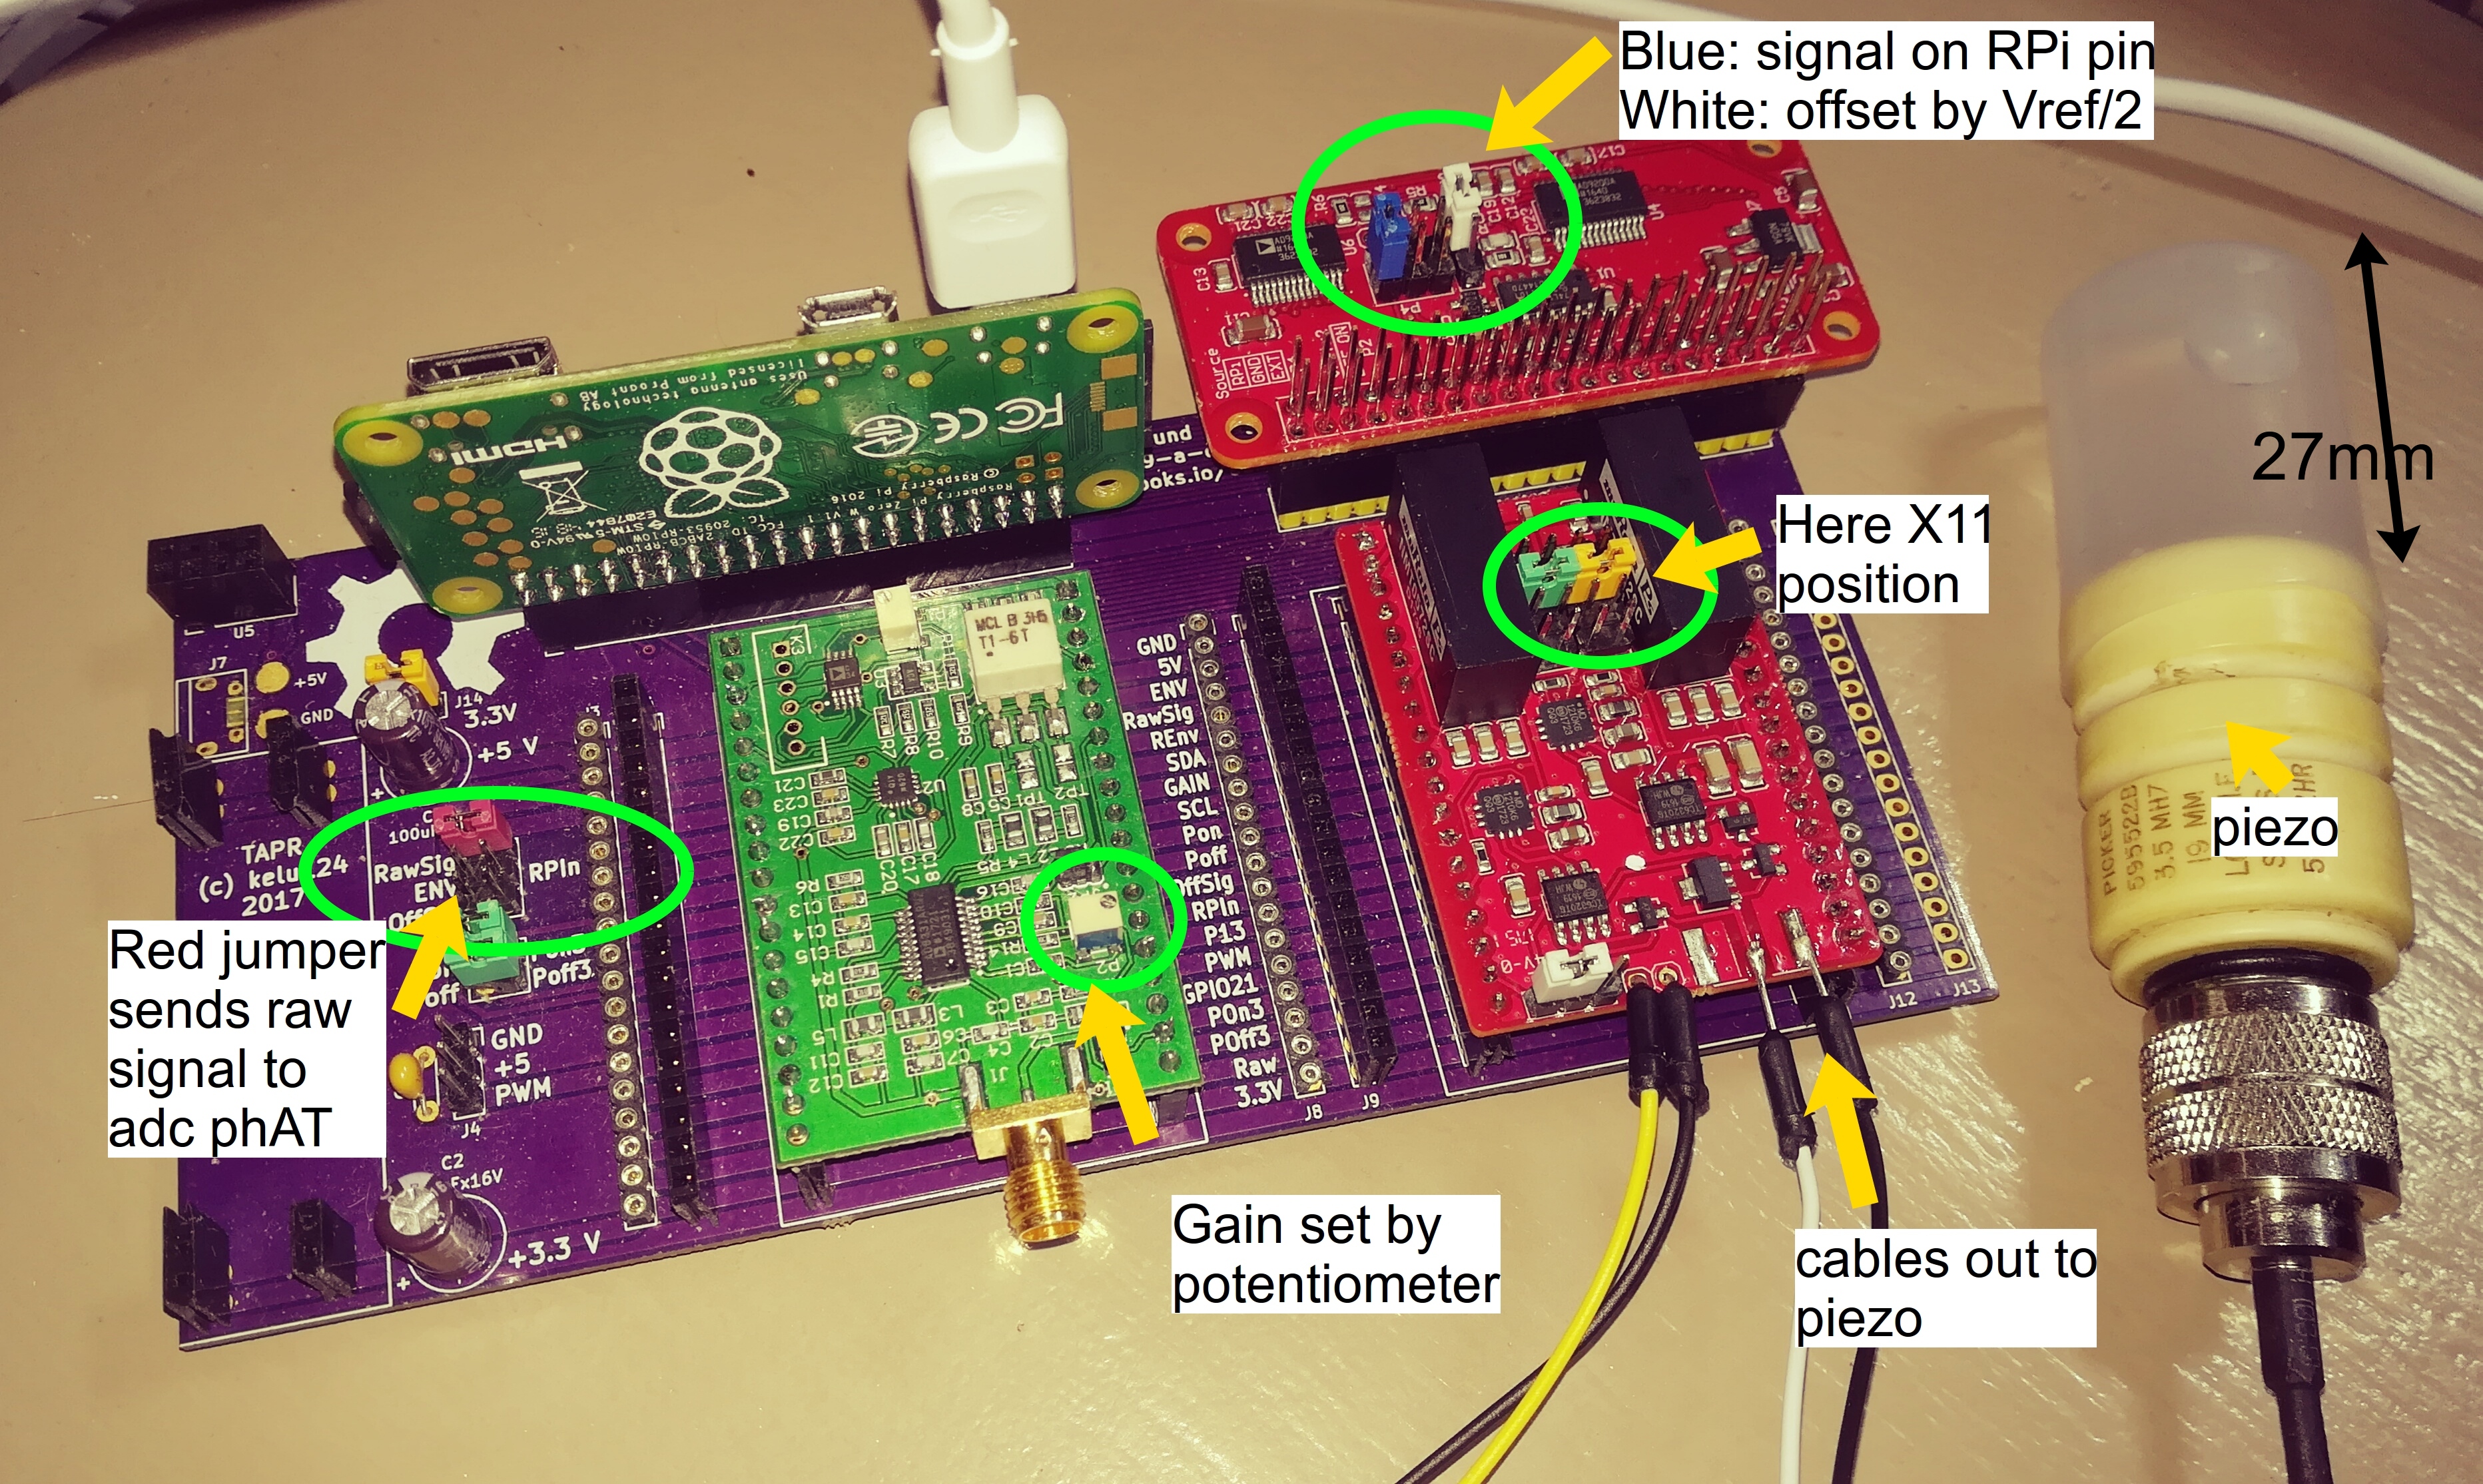
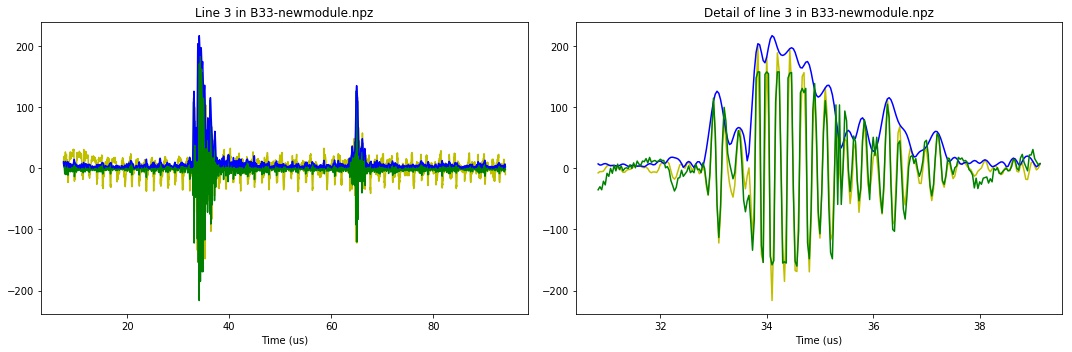
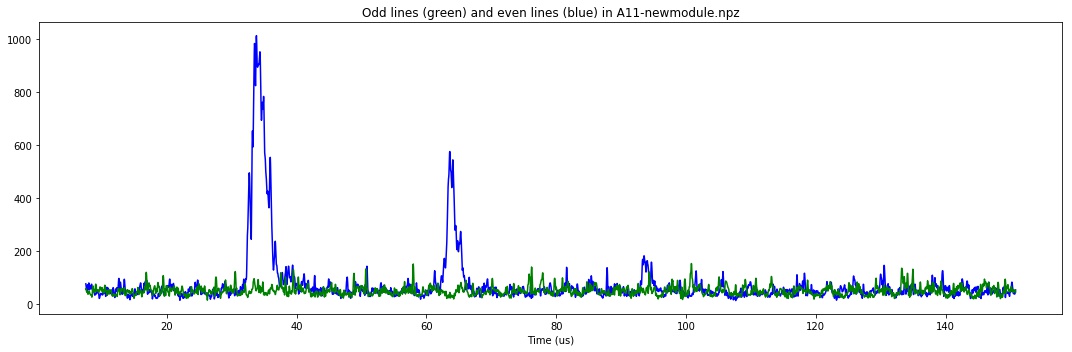
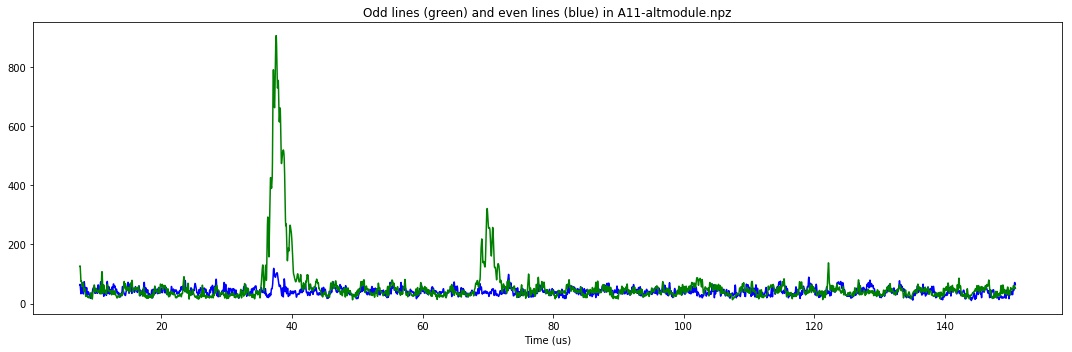
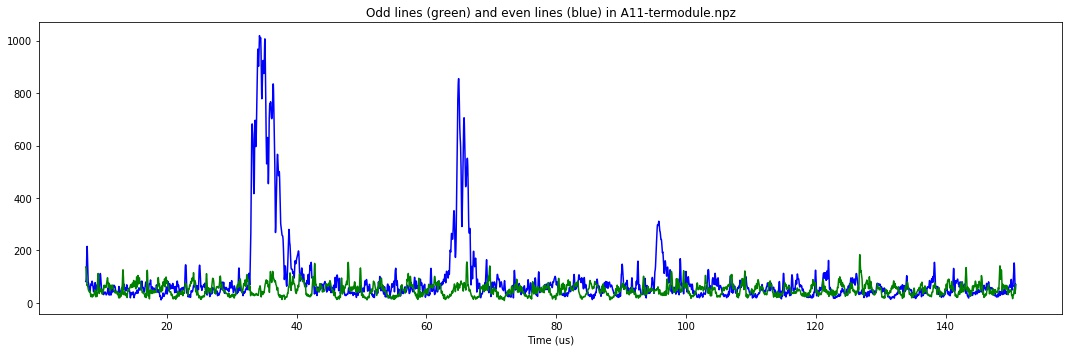
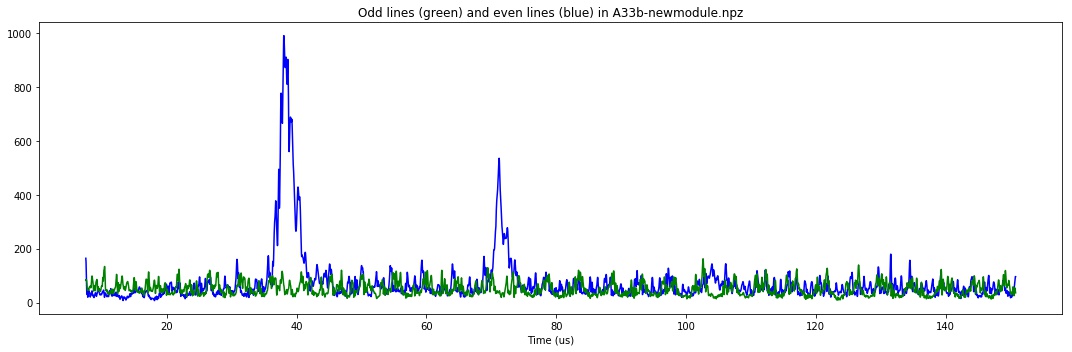
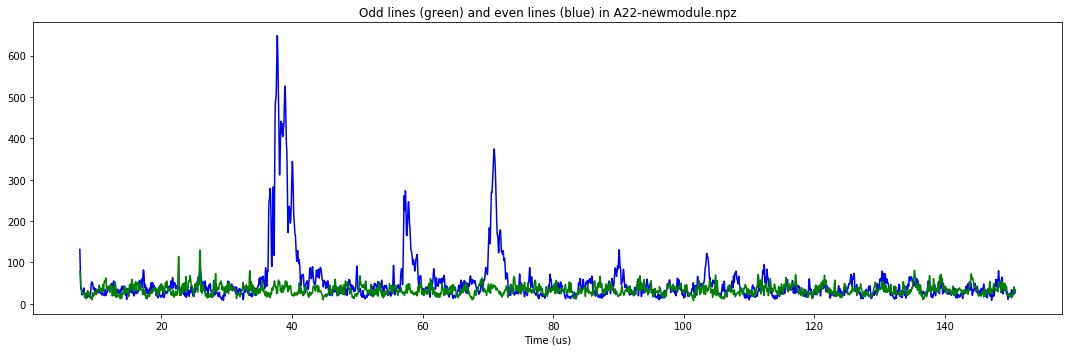
There is approximately 27mm of water before the reflector on the piezo. That's an echo which has to travel 2x27mm = 54mm, at 1500m/s. We should see at peak at around 36us, and, if a second reflection occurs, at 72us.
Results
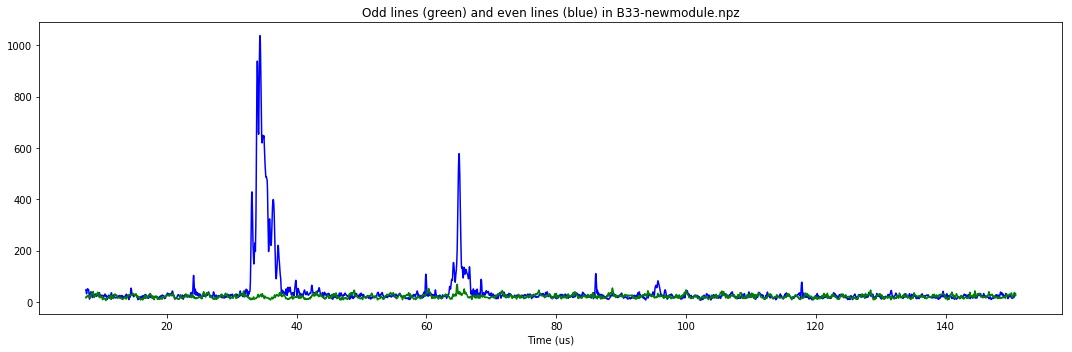
Better resolution can be achieved when the pulser code is cleaned from its errors.. Namely with a better control of the controling variables.
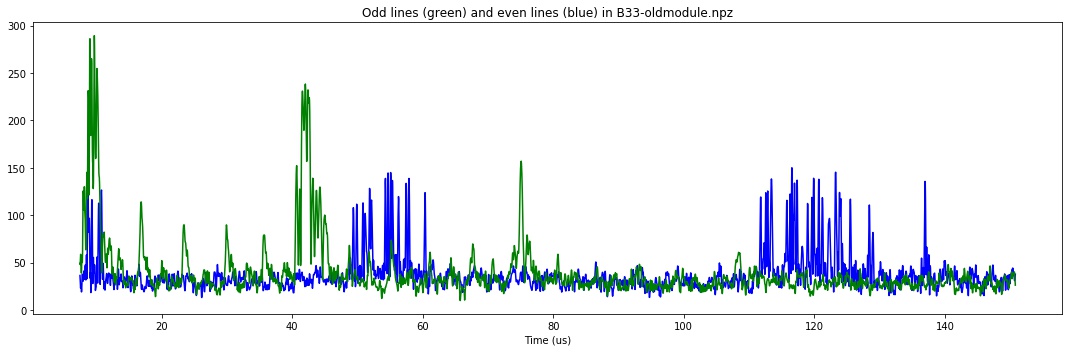
Before the new code
With the new code
Details of the lines
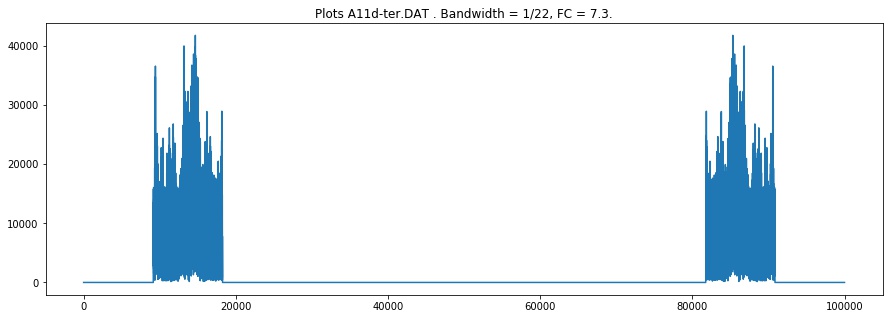
Raw lines
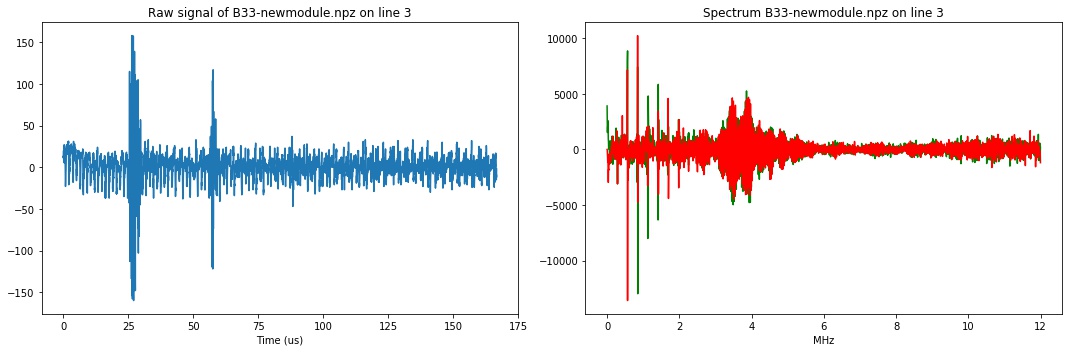
Once filtered
Remaining issues
It seems trig happens when line goes low:
Going low at t0 of pulse
Going low at first up, then down, so delayed
Classical pulses off, Pon going low
Automated list of supporting files for the experiment 20180217a
List of files
md
jupyter
python
Modules
Images of the Experiment
Raw images
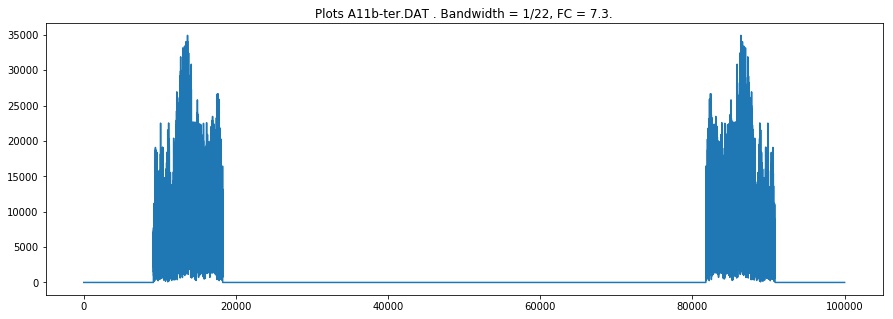
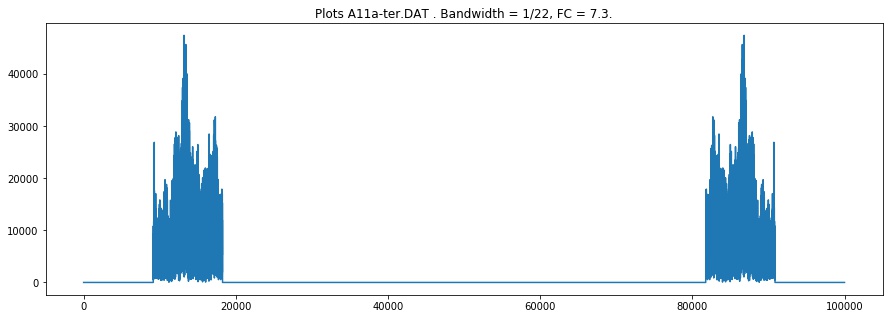
Cleaned line from the 20180217a experiment

Cleaned line from the 20180217a experiment
Raw line from the 20180217a experiment
Cleaned line from the 20180217a experiment
Cleaned line from the 20180217a experiment
Raw line from the 20180217a experiment
Cleaned line from the 20180217a experiment
Cleaned line from the 20180217a experiment
Cleaned line from the 20180217a experiment
Cleaned line from the 20180217a experiment
Others
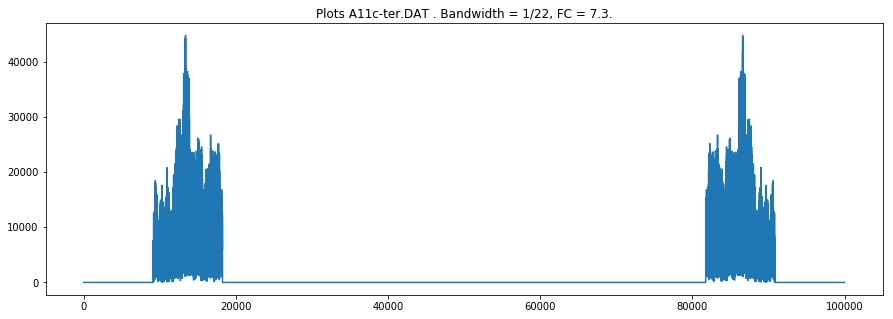
Spectrum of the DATA file from the 20180217a experiment (category: graph).

Map of the DATA file from the 20180217a experiment (category: graph).

Map of the DATA file from the 20180217a experiment (category: graph).

Map of the DATA file from the 20180217a experiment (category: graph).

Map of the DATA file from the 20180217a experiment (category: graph).
Spectrum of the DATA file from the 20180217a experiment (category: graph).
Spectrum of the DATA file from the 20180217a experiment (category: graph).

Map of the DATA file from the 20180217a experiment (category: graph).

Spectrum of the DATA file from the 20180217a experiment (category: graph).
Spectrum of the DATA file from the 20180217a experiment (category: graph).