20180430a - JSON Client - version p
import numpy as np
import matplotlib.pyplot as plt
from scipy import signal
from scipy.interpolate import griddata
import math
from scipy.signal import decimate, convolve
import json
import re
import glob, os
Creating the set of acquisitions
Serie = "wire"
DataSet = {}
for data in glob.glob(Serie+"/p_ser*.json"):
print data
with open(data) as json_data:
IDLine = []
TT1 = []
TT2 = []
tmp = []
DataSet[data] = {}
d = json.load(json_data)
json_data.close()
A = d["data"][1:]
if (A[0]) > 128:
print "first"
for i in range(len(A)/2-1):
value = 128*(A[2*i+0]&0b0000111) + A[2*i+1] - 512
IDLine.append((A[2*i+1]&0b11110000)/16) # Identify the # of the line
TT1.append( (A[2*i+0] & 0b00001000) / 0b1000)
TT2.append( (A[2*i+0] & 0b00010000) / 0b10000)
tmp.append( value )
else:
print "second"
for i in range(len(A)/2-1):
value = 128*(A[2*i+1]&0b111) + A[2*i+2] - 512
IDLine.append((A[2*i+1]&0b11110000)/16)
TT1.append( (A[2*i+1] & 0b00001000) / 0b1000)
TT2.append( (A[2*i+1] & 0b00010000) / 0b10000)
tmp.append( value )
DataSet[data]["data"] = tmp
DataSet[data]["IDLine"] = IDLine
DataSet[data]["TT1"] = TT1
DataSet[data]["TT2"] = TT2
DataSet[data]["registers"] = d["registers"]
DataSet[data]["position"] = d["position"]
DataSet[data]["f"] = float(64/((1.0+int( d["registers"]["237"] ) )))
t = [ 1.0*x/DataSet[data]["f"] for x in range(len(tmp))]
DataSet[data]["t"] = t
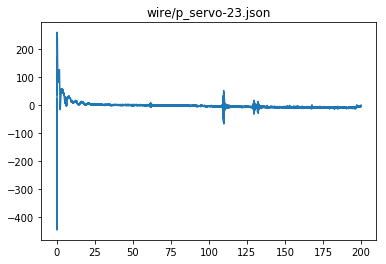
plt.plot(t,tmp)
plt.title(data)
plt.savefig(data+".jpg")
plt.show()
wire/p_servo-23.json
second
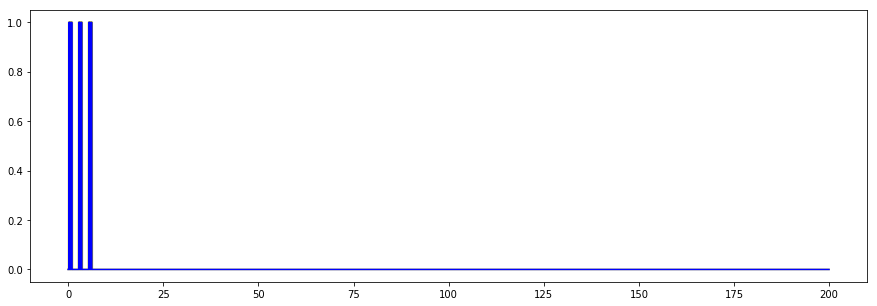
Checking if arduino works to signal position
Check if position is well marked
This should happen 3 times on the line
L1 = DataSet.keys()[0]
plt.figure(figsize=(15,5))
Position = 60 +  DataSet[L1]["position"]
print str(bin(Position))
plt.plot(DataSet[L1]["t"],DataSet[L1]["TT1"],"y")
plt.plot(DataSet[L1]["t"],DataSet[L1]["TT2"],"b")
plt.show()
0b1010010
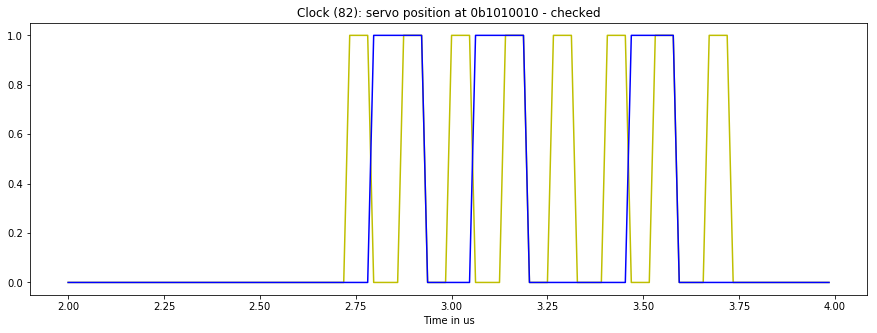
L1 = DataSet.keys()[0]
plt.figure(figsize=(15,5))
Position = 60 +  DataSet[L1]["position"]
print str(bin(Position))
plt.plot(DataSet[L1]["t"][2*64:4*64],DataSet[L1]["TT1"][2*64:4*64],"y")
plt.plot(DataSet[L1]["t"][2*64:4*64],DataSet[L1]["TT2"][2*64:4*64],"b")

plt.title("Clock ("+str(Position)+"): servo position at "+str(bin(Position)) + " - checked")
plt.savefig(Serie+"/clock_check_pos"+str(Position)+".jpg", bbox_inches='tight')
plt.xlabel("Time in us")
plt.show()
0b1010010
Get back to the image
Using previously saved images sets.
Serie = "pu90"
filz = np.load(Serie+"/dataset.npz")
filz.files
['arr_1', 'arr_0']
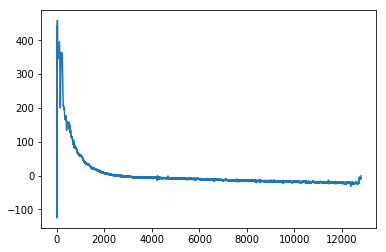
image = filz["arr_1"]
plt.plot(image[24])
plt.show()
Let's check if a signal is well here
TestLine = 24

rawSig = image[TestLine]
FFT = np.fft.fft(rawSig)
FFTCleaned = np.fft.fft(rawSig)
FStart = 0.068*len(FFTCleaned)*0.7
FStop = 0.196*len(FFTCleaned)*0.5
for k in range(len(FFTCleaned)/2):
    if (k < FStart or k > FStop): # in (k < 550000 or k > 790000) # 0.068 0.196
        FFTCleaned[k] = 0
        FFTCleaned[-k] = 0

Scale = max(FFT)
ff = [ 64*2.0*x/(2*len(rawSig)) for x in range(len(rawSig)/2)]

plt.figure(figsize=(15,5))
plt.plot(ff[len(FFT)/35:len(FFT)/2],np.abs(FFT)[len(FFT)/35:len(FFT)/2]/Scale,"b")
plt.plot(ff[len(FFT)/35:len(FFT)/2],np.abs(FFTCleaned)[len(FFT)/35:len(FFT)/2]/Scale,"y")
plt.title("Details of the FFT - line "+str(TestLine)+".")
plt.xlabel("Frequency (MHz)")
plt.savefig(Serie+"/fft.jpg", bbox_inches='tight')
plt.show()
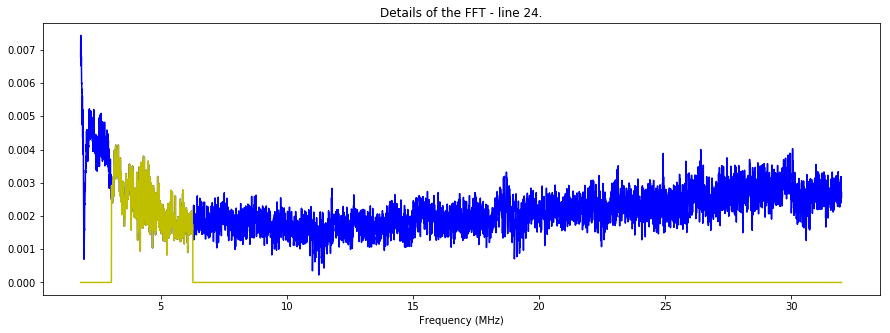
Seems fine
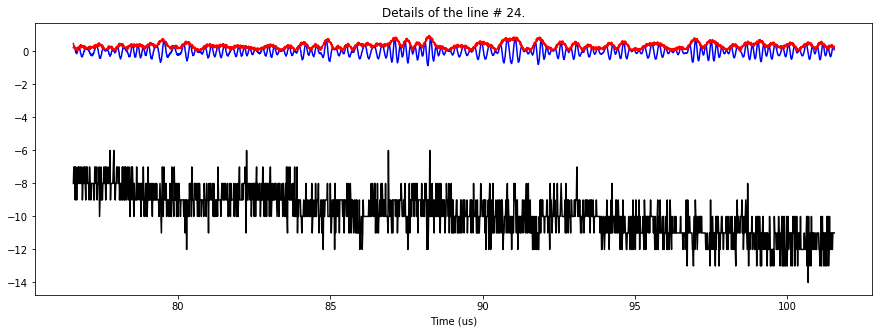
F = np.real(np.fft.ifft(FFTCleaned))
FH = np.asarray(np.abs(signal.hilbert(F)))
t = [ 1.0*x/64.0 for x in range(len(rawSig))]

plt.figure(figsize=(15,5))

plt.plot(t[4900:6500],F[4900:6500],"b")
plt.plot(t[4900:6500],rawSig[4900:6500],"k")
plt.plot(t[4900:6500],FH[4900:6500],"r")

plt.title("Details of the line # "+str(TestLine)+".")
plt.xlabel("Time (us)")
plt.savefig(Serie+"/fft.jpg", bbox_inches='tight')

plt.show()
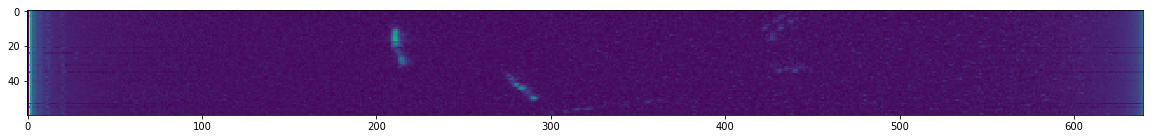
Let's apply this to all cells
Hilberted = []

for j in range(len(image)):
    rawSig = image[j]
    FFT = np.fft.fft(rawSig)
    FFTCleaned = np.fft.fft(rawSig)
    FStart = 0.068*len(FFTCleaned)*0.7
    FStop = 0.196*len(FFTCleaned)*0.5
    for k in range(len(FFTCleaned)/2):
        if (k < FStart or k > FStop): # in (k < 550000 or k > 790000) # 0.068 0.196
            FFTCleaned[k] = 0
            FFTCleaned[-k] = 0

    Scale = max(FFT)
    ff = [ 64*2.0*x/(2*len(rawSig)) for x in range(len(rawSig)/2)]

    F = np.real(np.fft.ifft(FFTCleaned))
    FH = np.asarray(np.abs(signal.hilbert(F)))

    Hilberted.append(FH)
DH = []
for j in range(len(image)):
    DH.append( decimate(Hilberted[j], 20, ftype='fir') )

plt.figure(figsize=(20,10))
plt.imshow(np.sqrt(DH))
plt.show()
def CreateSC(RawImgData):
    LenLinesC = np.shape(RawImgData)[1]
    NbLinesC = np.shape(RawImgData)[0]

    print LenLinesC,NbLinesC
    SC = np.zeros((LenLinesC,LenLinesC))+200
    SC += 1
    maxAngle = 60.0
    step = maxAngle/(NbLinesC+1)
    CosAngle = math.cos(math.radians(30))
    Limit = LenLinesC*CosAngle

    points = []
    values = []

    for i in range(LenLinesC):
        for j in range(LenLinesC):
            if (  (j > LenLinesC/2 + i/(2*CosAngle)) or  (j < LenLinesC/2 - i/(2*CosAngle)) ):
                SC[i][j] = 0
                points.append([i,j])
                values.append(0)
            if (  (i > Limit) ):
                if ( (i**2 + (j-LenLinesC/2) ** 2) > LenLinesC**2):
                    SC[i][j] = 0
                    points.append([i,j])
                    values.append(0)
    for i in range(NbLinesC):
        PointAngle = i*step-30
        COS = math.cos(math.radians(PointAngle))
        SIN = math.sin(math.radians(PointAngle))
        for j in range(LenLinesC):

            X = (int)( j*COS)
            Y = (int)(LenLinesC/2 - j*SIN)
            SC[X][Y] = RawImgData[i][j]
            points.append([X,Y])
            values.append(RawImgData[i][j])

    values = np.array(values,dtype=np.float)


    return SC,values,points,LenLinesC
SCH,valuesH,pointsH,LenLinesCH = CreateSC(np.sqrt(DH))
grid_xH, grid_yH = np.mgrid[0:LenLinesCH:1, 0:LenLinesCH:1]
grid_z1H = griddata(pointsH, valuesH, (grid_xH, grid_yH), method='linear')
640 60
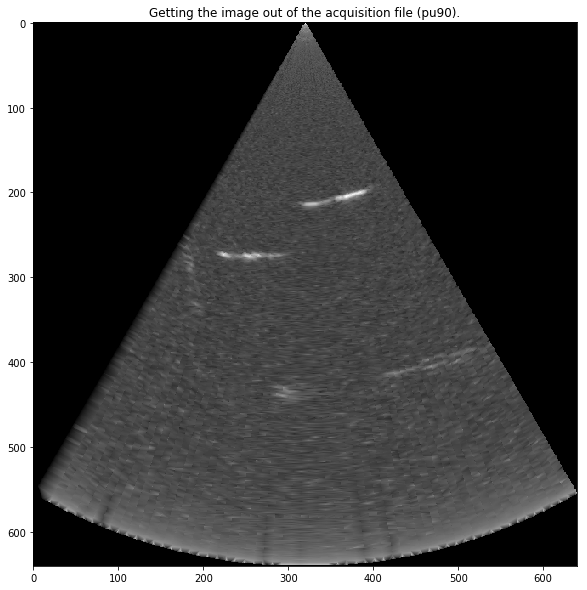
plt.figure(figsize=(10,10))
plt.imshow(((grid_z1H+0.01)**0.5),cmap=plt.get_cmap('gray'))
plt.title("Getting the image out of the acquisition file ("+Serie+").")
plt.savefig(Serie+"/SCImage.jpg", bbox_inches='tight')
plt.show()