Experiment 20190713a description
Automated list of supporting files for the experiment 20190713a
List of files
md
jupyter
python
Modules
Images of the Experiment
Setup
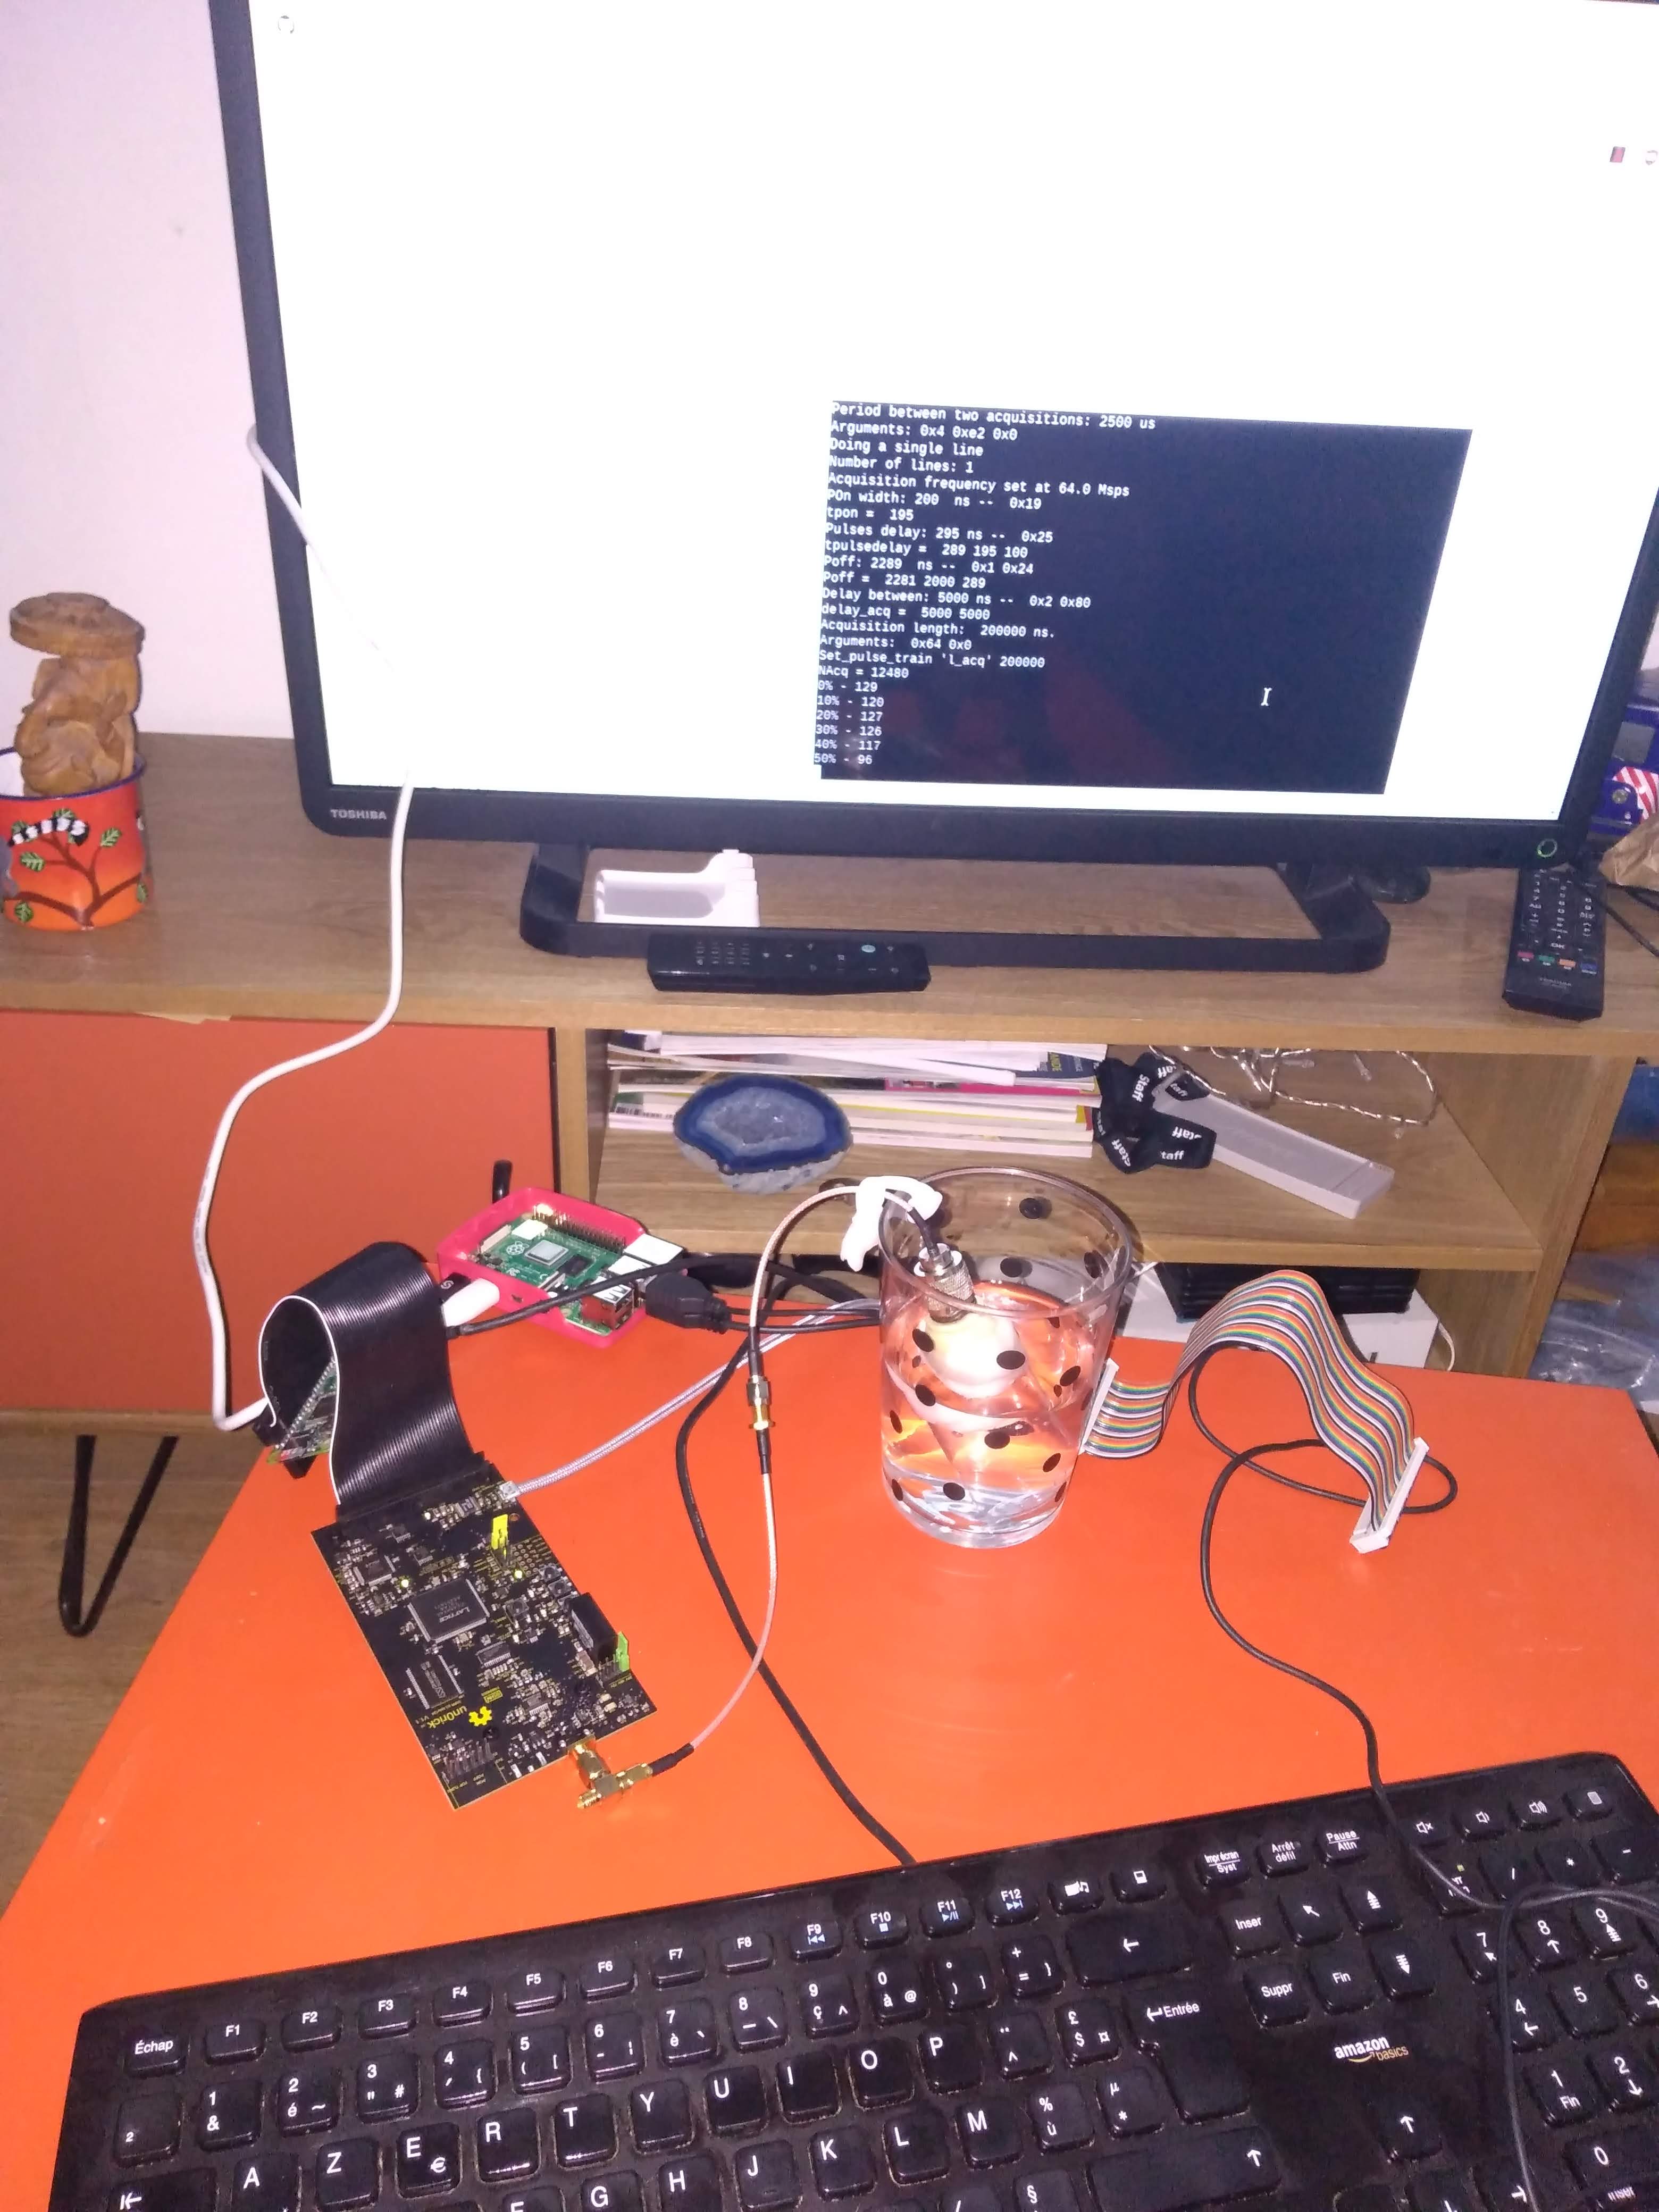
Test of the new batches
Others
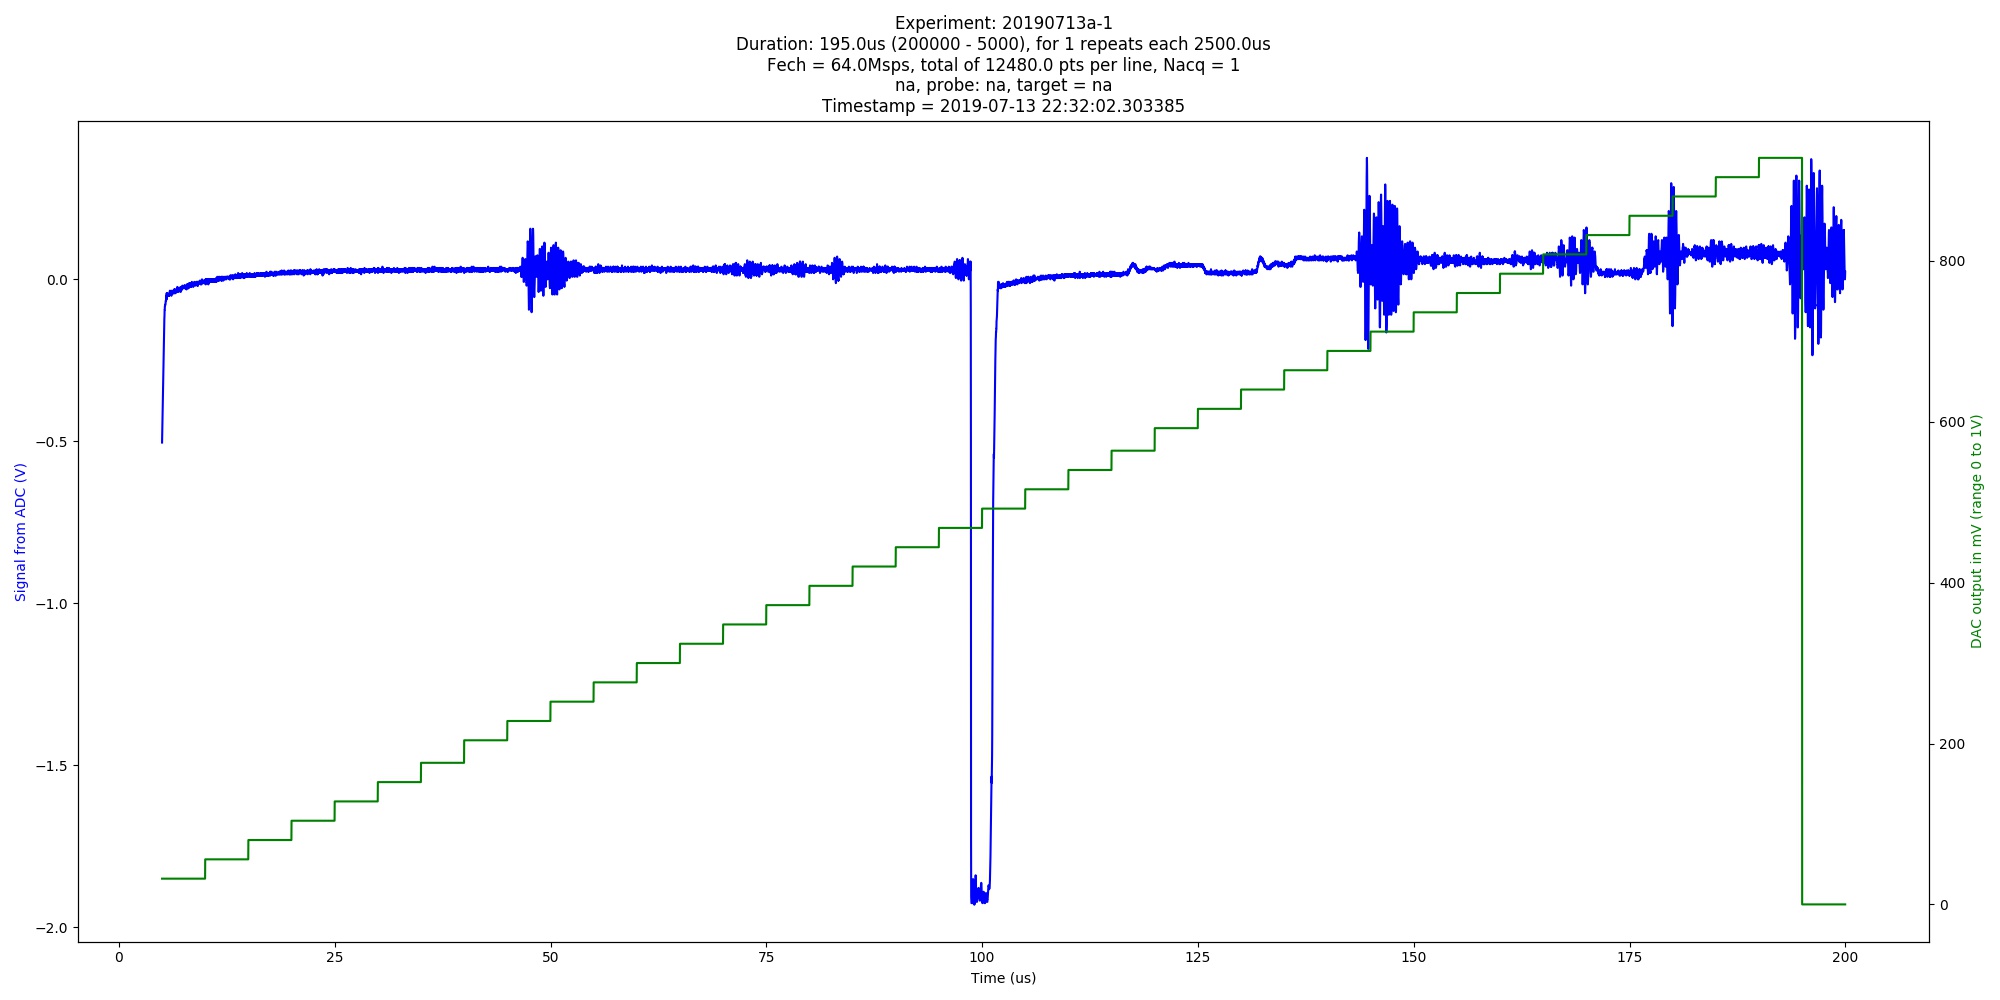
Automated image of 20190713a experiment. na (category: graph).
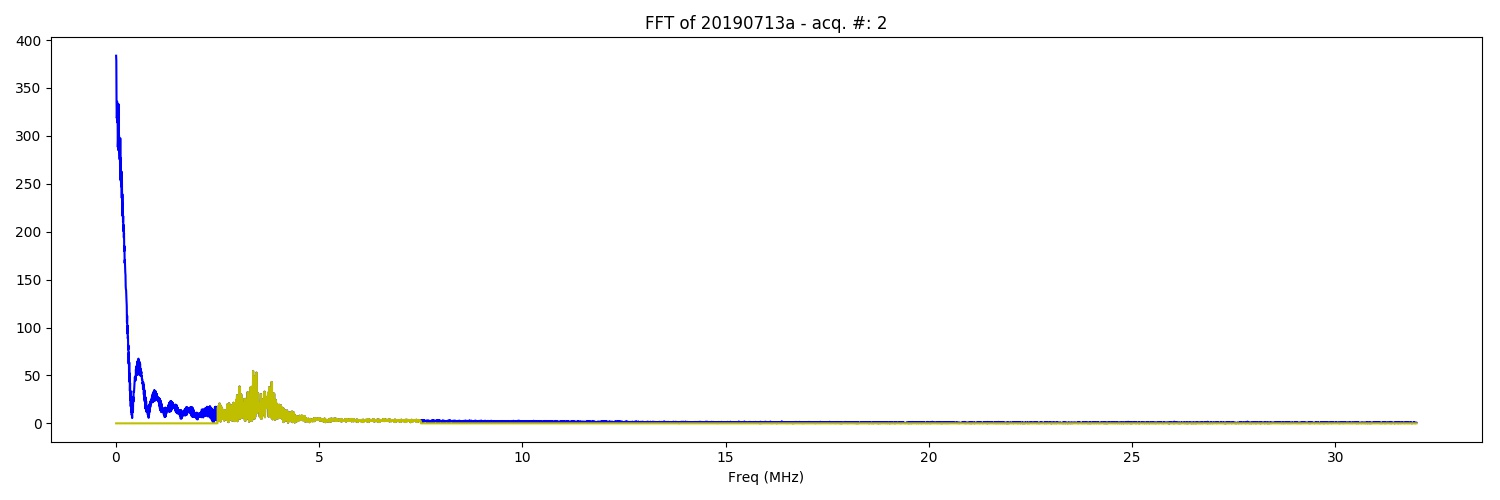
FFT of the of 20190713a experiment. na (category: FFT).
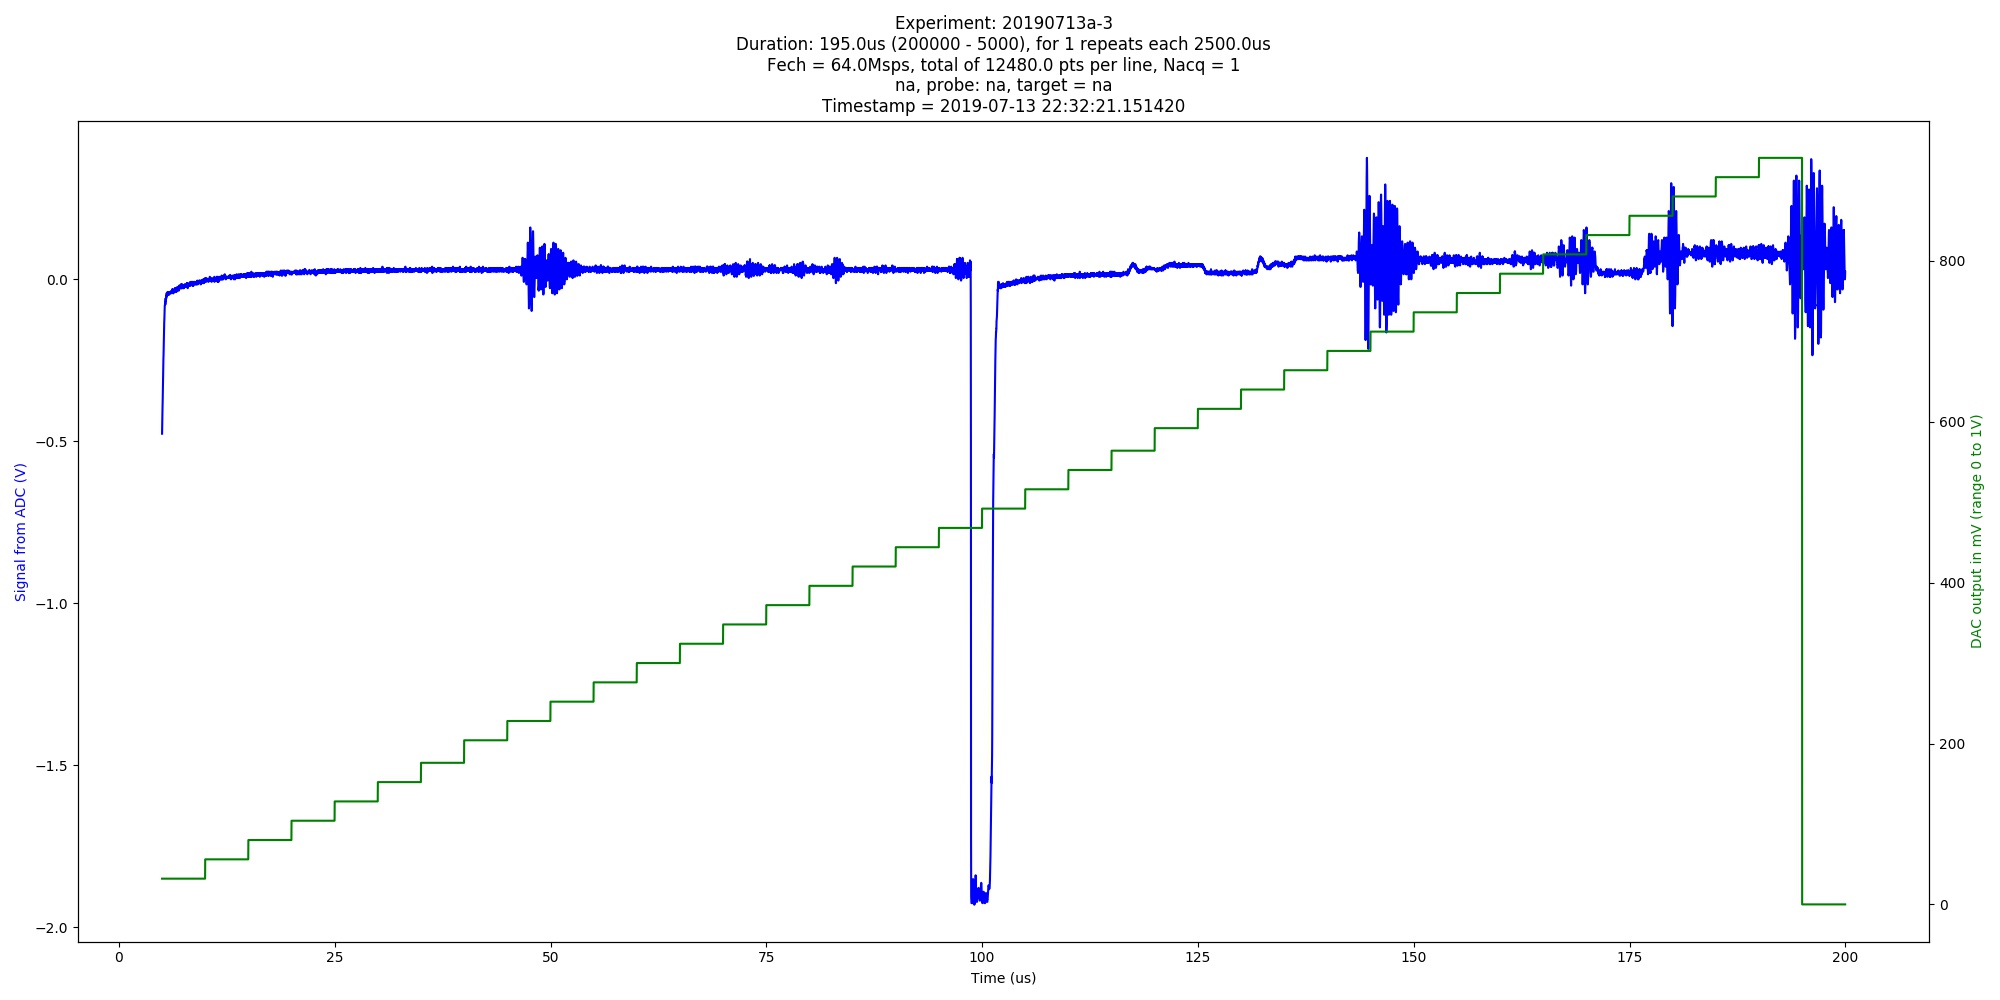
Automated image of 20190713a experiment. na (category: graph).
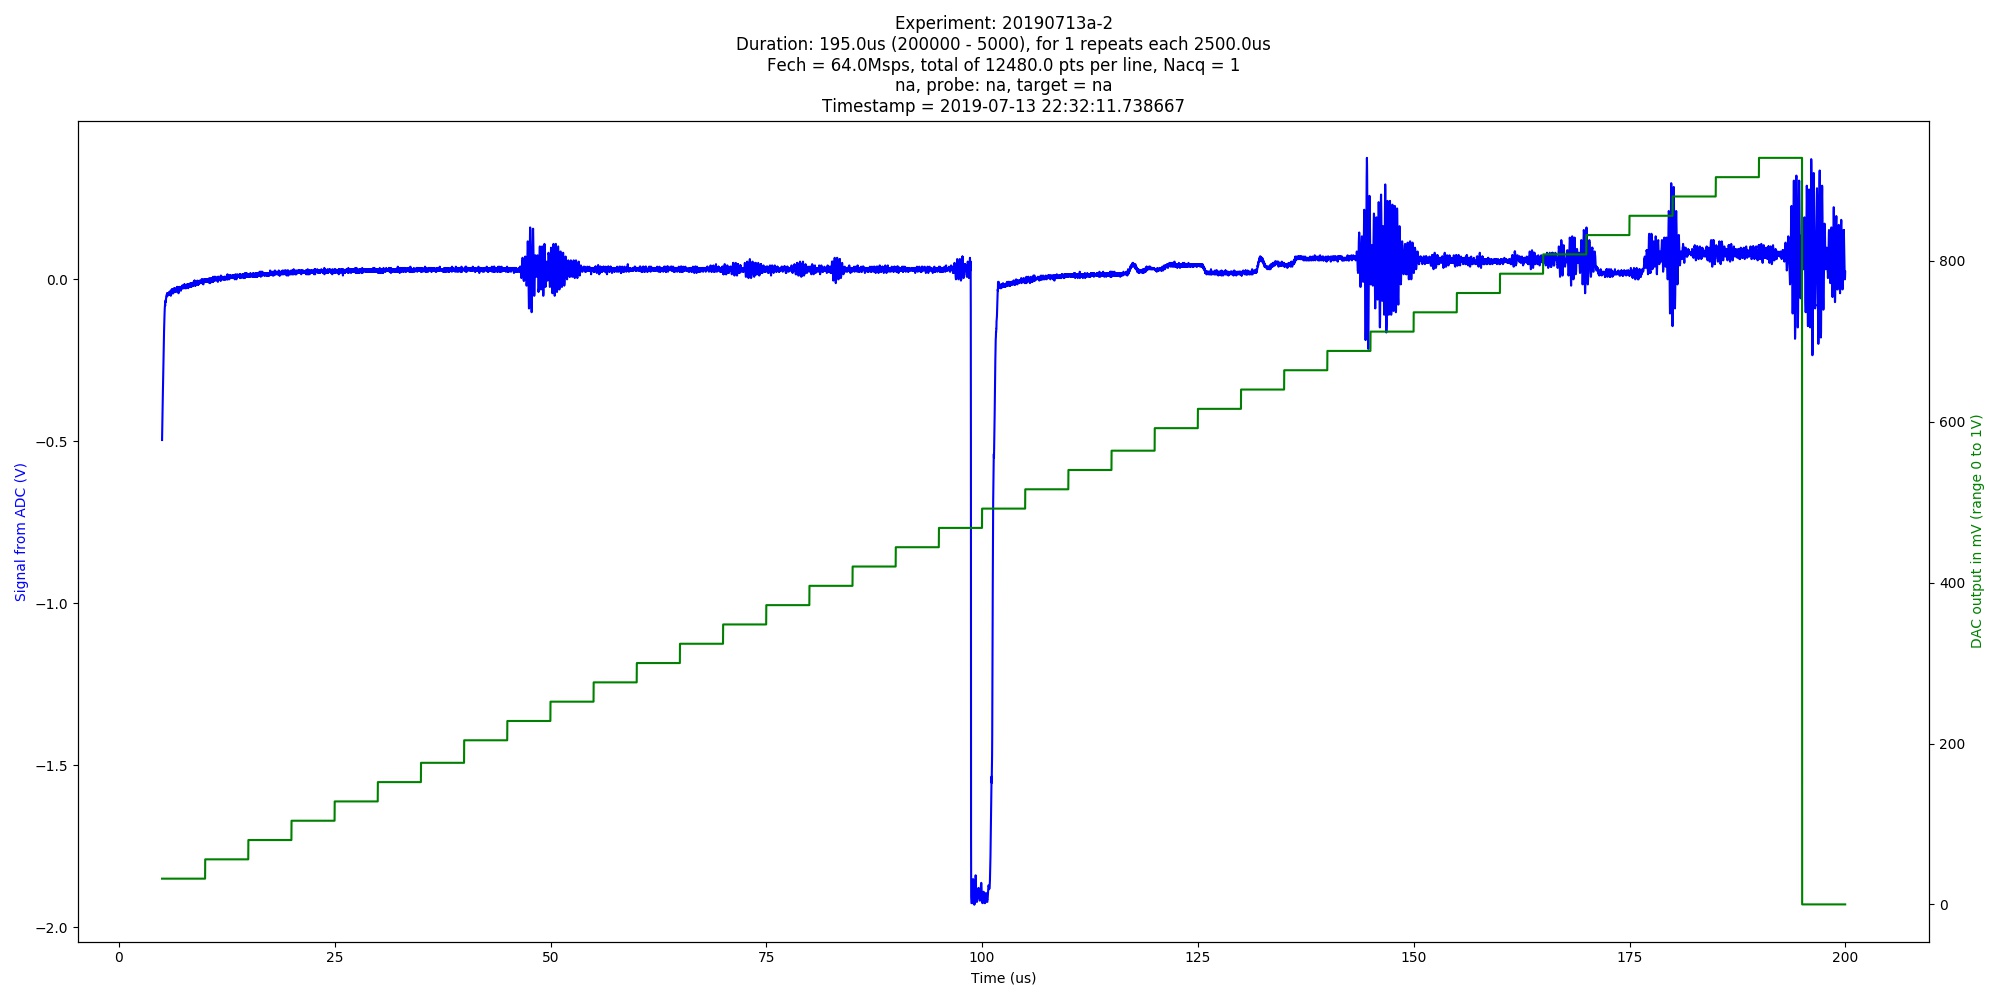
Automated image of 20190713a experiment. na (category: graph).
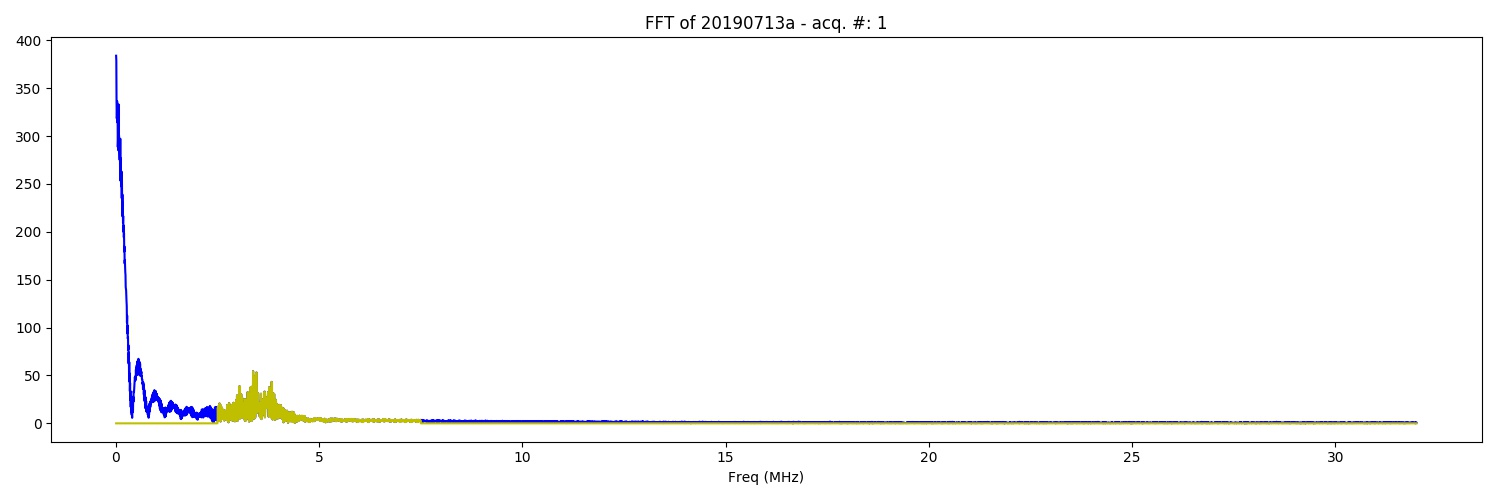
FFT of the of 20190713a experiment. na (category: FFT).
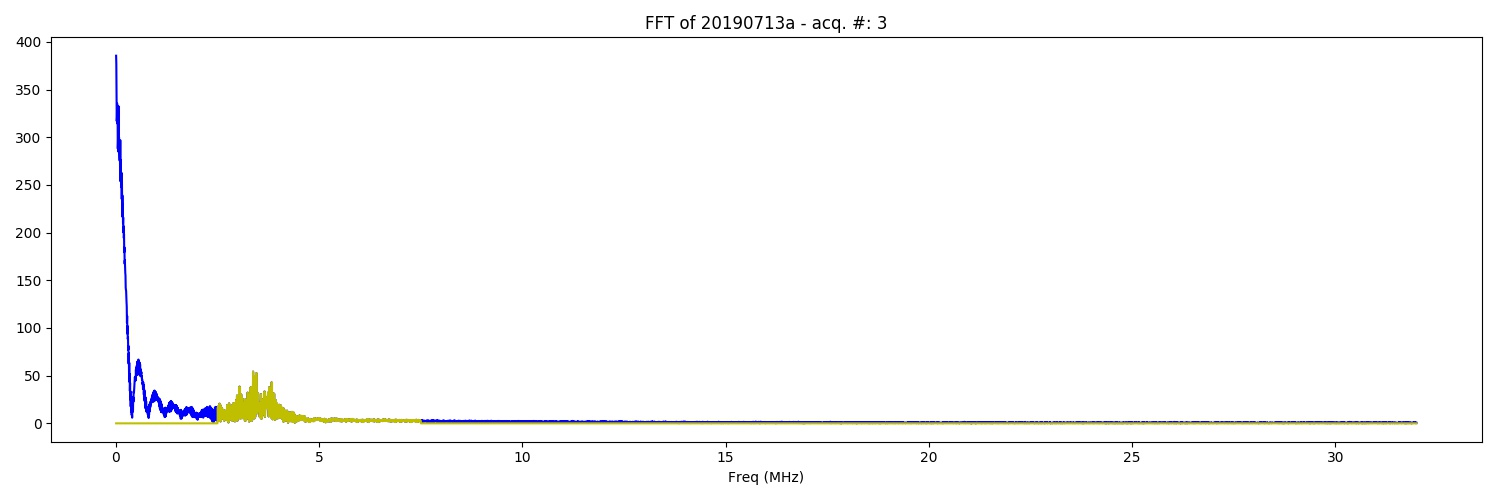
FFT of the of 20190713a experiment. na (category: FFT).

FFT of the of 20190713a experiment. na (category: FFT).

Automated image of 20190713a experiment. na (category: graph).

Automated image of 20190713a experiment. na (category: graph).

FFT of the of 20190713a experiment. na (category: FFT).
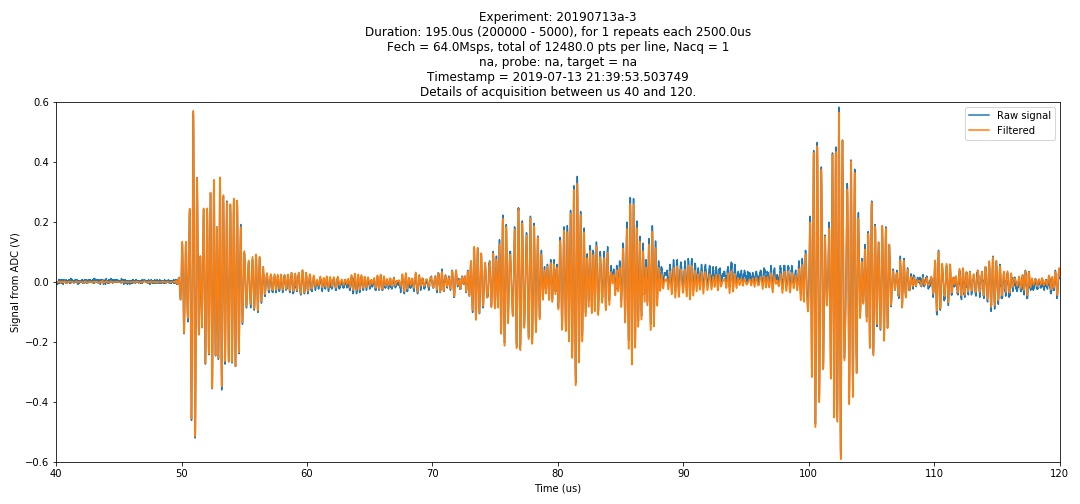
Experiment: 20190713a-3 Duration: 195.0us (200000 - 5000), for 1 repeats each 2500.0us Fech = 64.0Msps, total of 12480.0 pts per line, Nacq = 1 na, probe: na, target = na Timestamp = 2019-07-13 21:39:53.503749 Details of acquisition between us 40 and 120. (category: graph).

FFT of the of 20190713a experiment. na (category: FFT).