import spidev
import time
import numpy as np
import matplotlib
matplotlib.use('Agg')
import matplotlib.pyplot as plt
import json
import time
from pyUn0 import *
%matplotlib inline
import os
from scipy.signal import hilbert, resample
import cv2
Not loading RPi.GPIO as not on RPi
for MyDataFile in os.listdir("data/"):
if MyDataFile.endswith(".json"):
x = us_json()
x.JSONprocessing("data/"+MyDataFile)
CleanImage = x.mk2DArray()
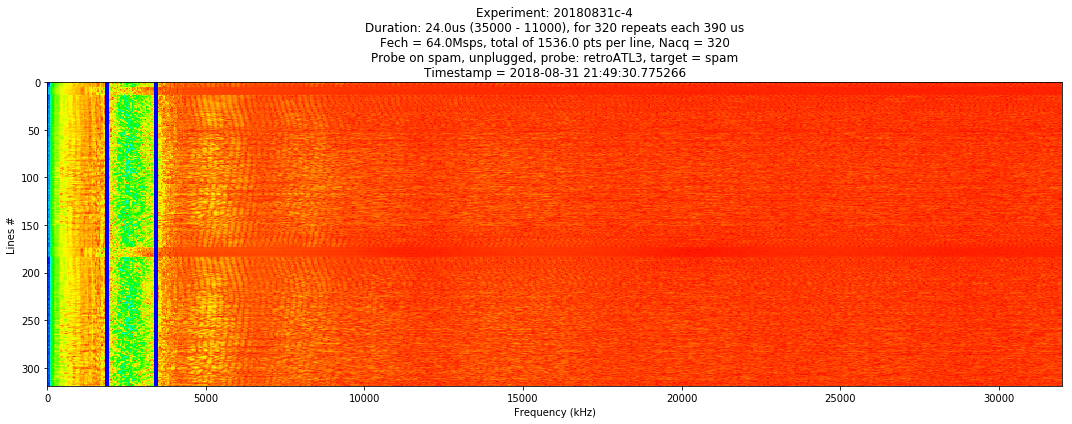
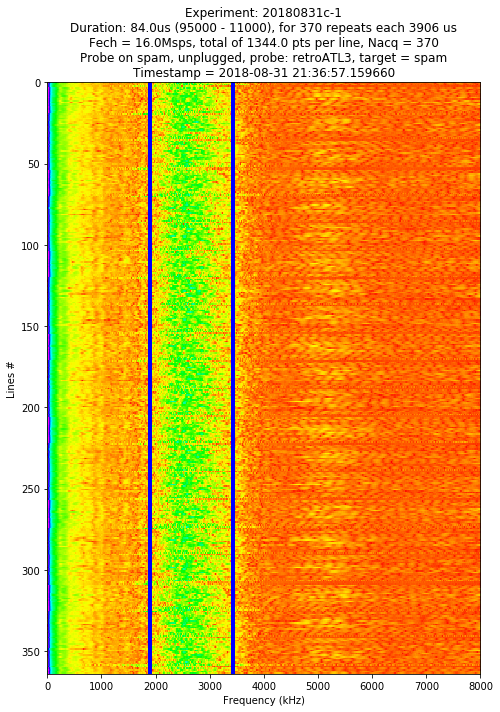
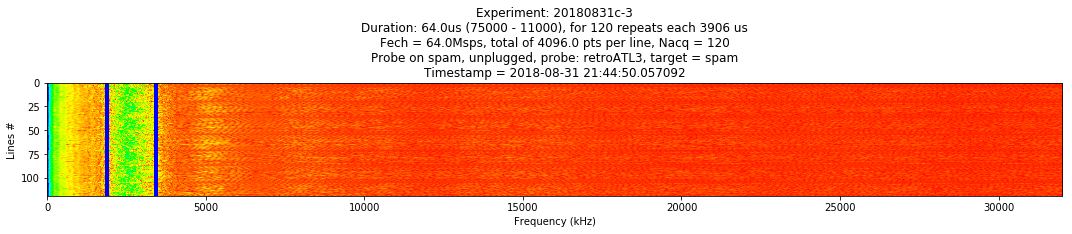
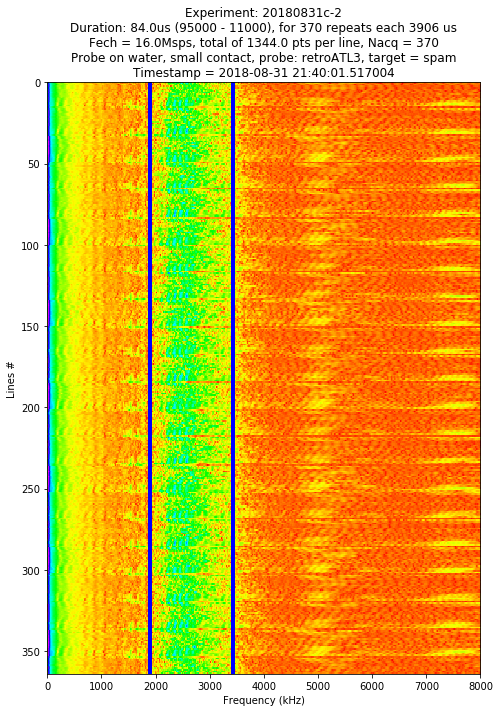
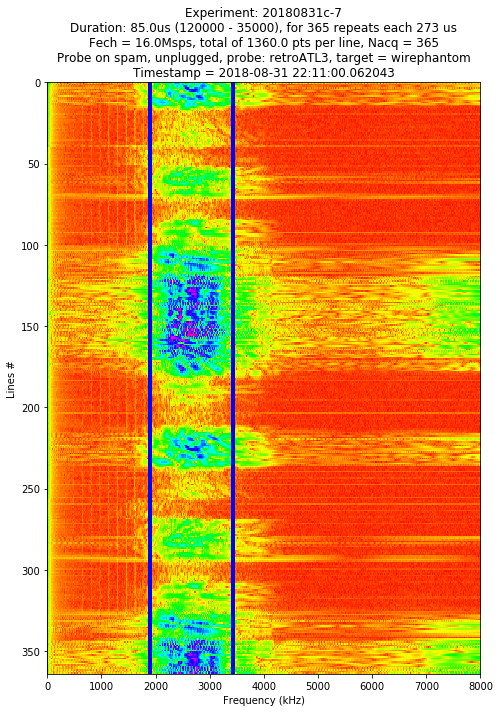
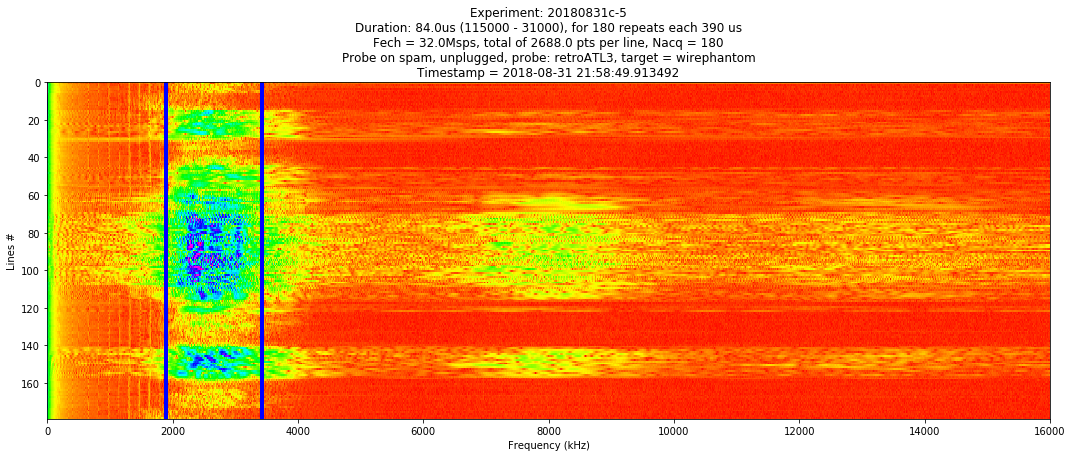
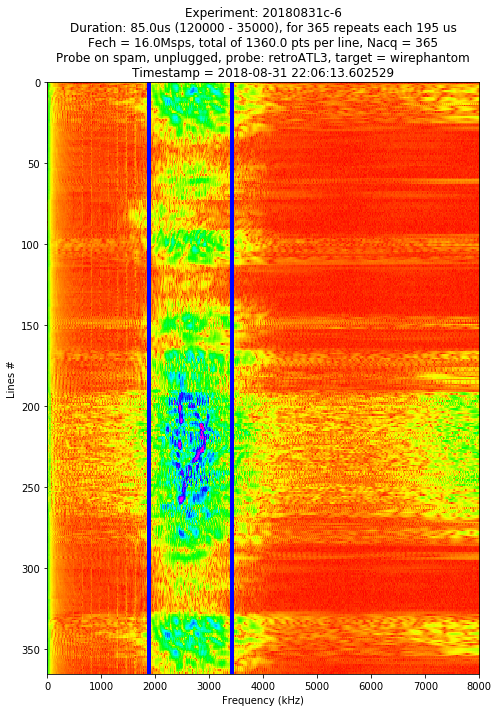
S = x.mkSpectrum(CleanImage)
Data acquired

Data acquired

Data acquired

Data acquired
Data acquired
Data acquired
Data acquired
for MyDataFile in os.listdir("data/"):
    if MyDataFile.endswith("c-6.json"):
        x = us_json()
        x.JSONprocessing("data/"+MyDataFile)
        CleanImage = x.mk2DArray()
        S = x.mkSpectrum(CleanImage)
Data acquired
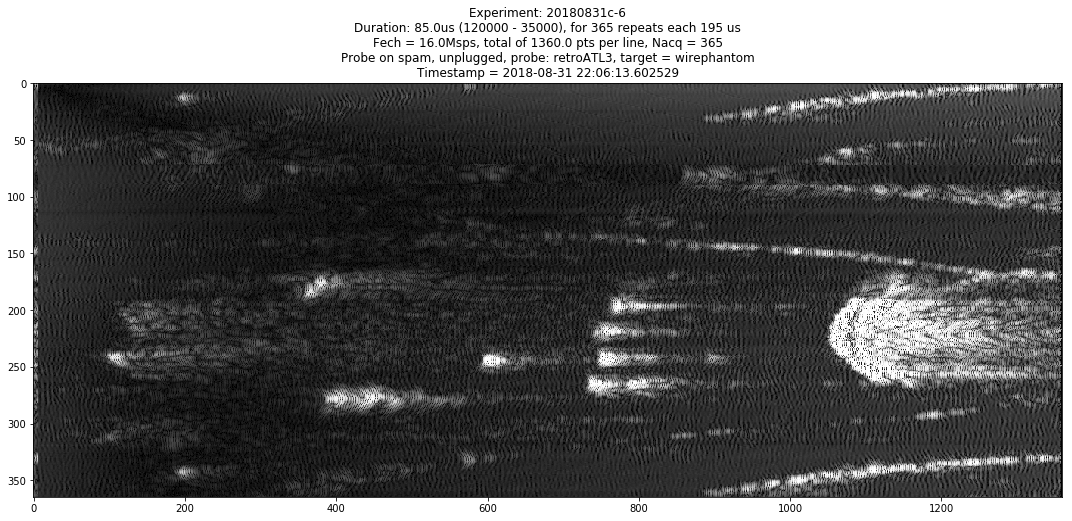
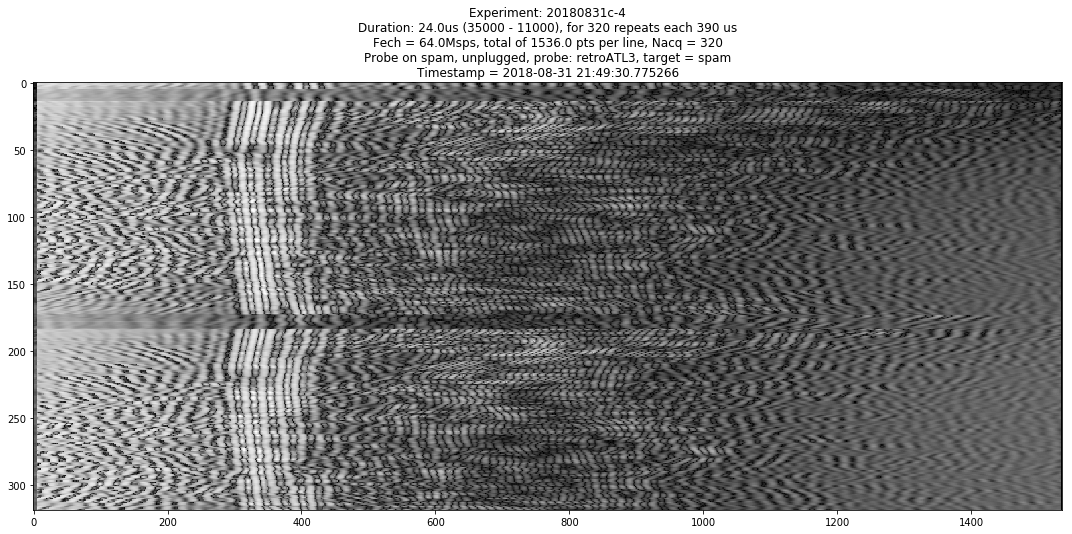
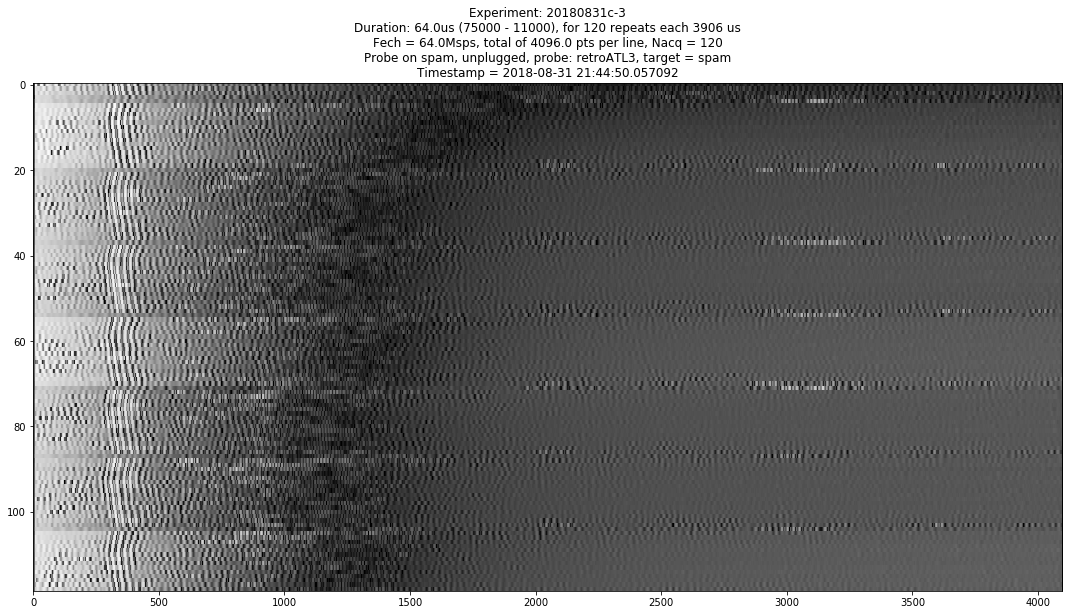
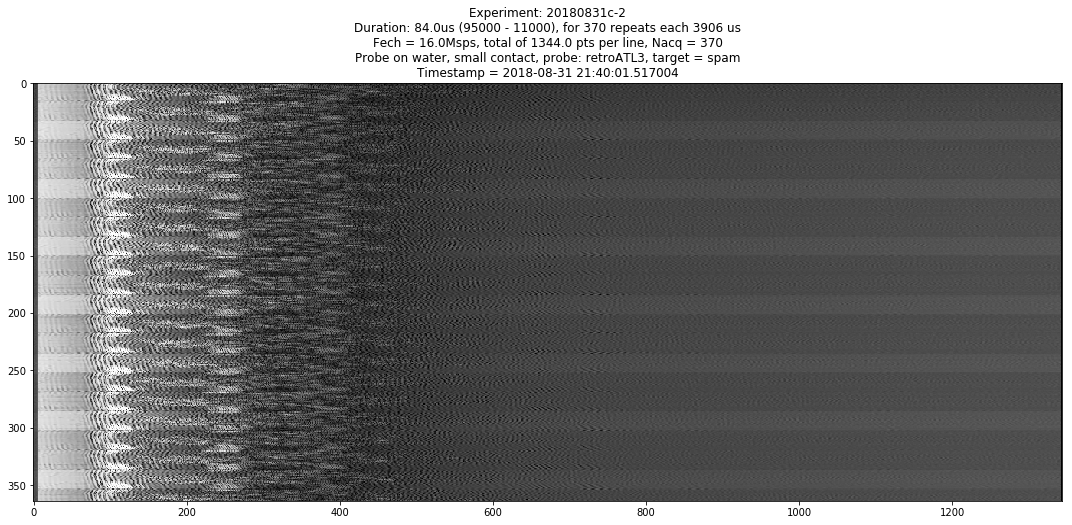
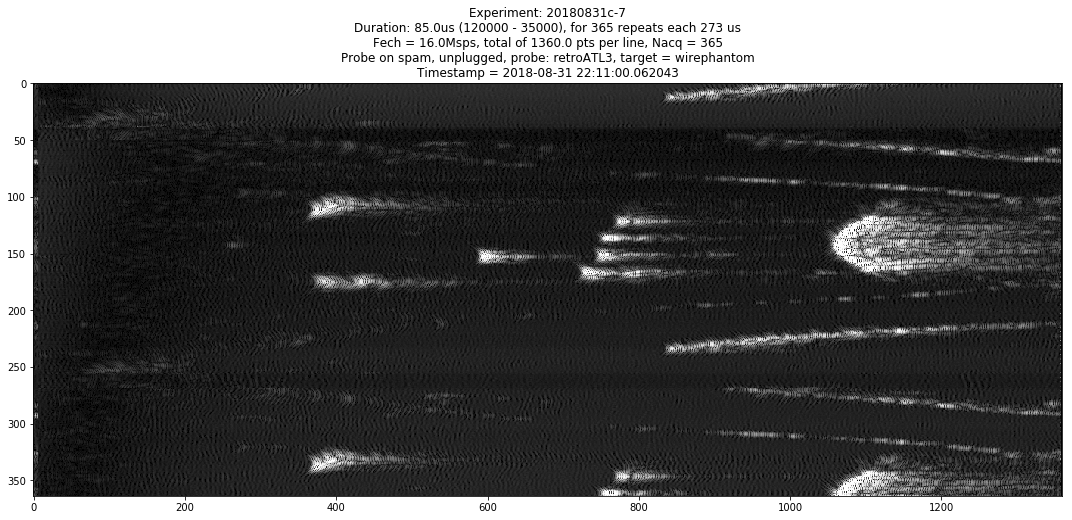
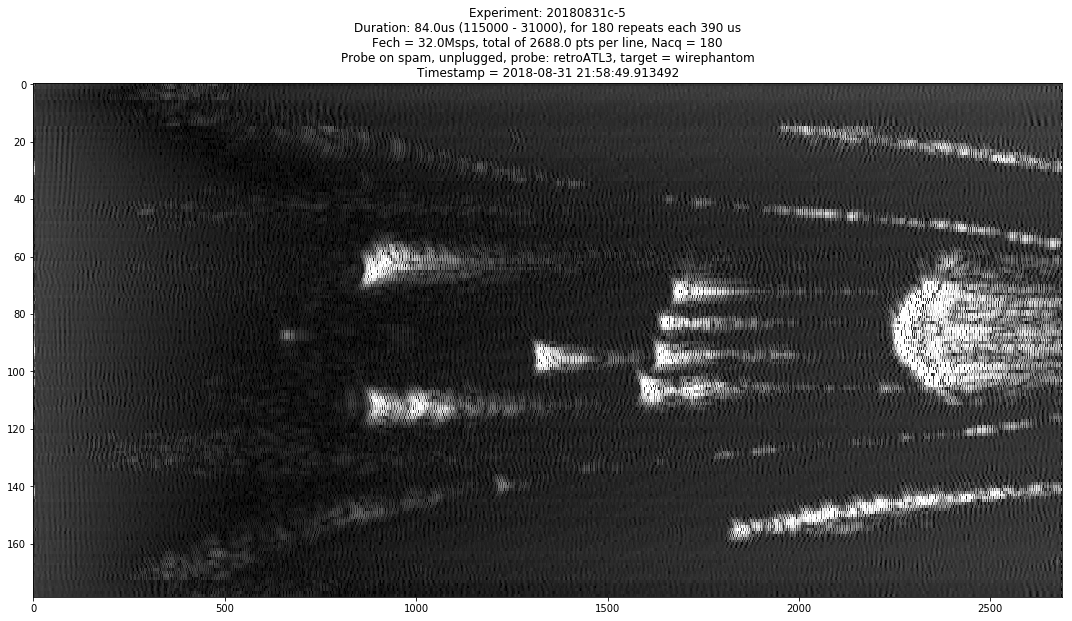
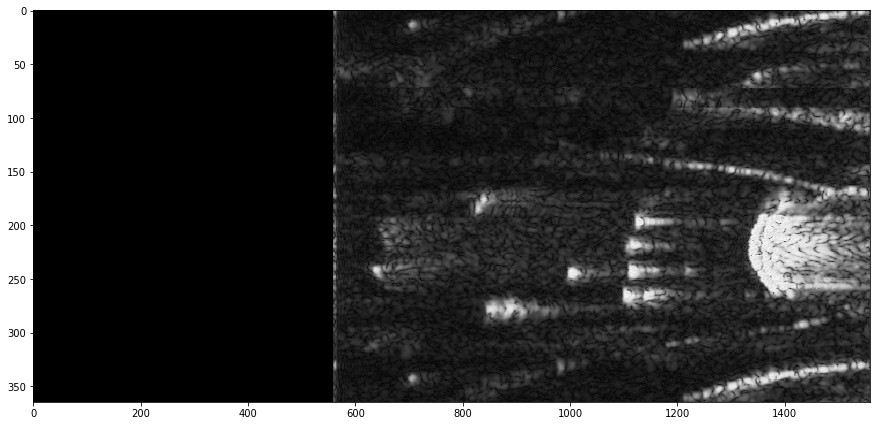
Building clean image
plt.imshow((CleanImage[:,10:400]))
<matplotlib.image.AxesImage at 0x7f21d431b750>
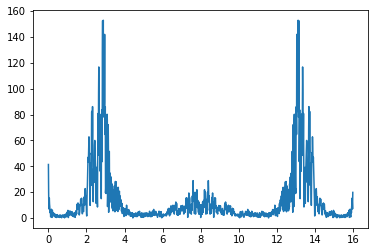
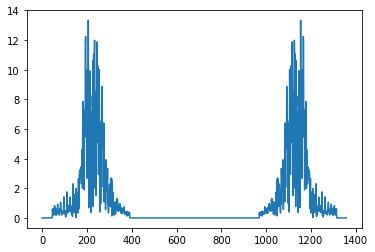
MV = np.argmax(np.var(CleanImage, axis=1))
L = len(CleanImage[MV])
f = [k*x.f/L for k in range(L)]
plt.plot(f, np.abs(np.fft.fft(CleanImage[MV])))
plt.show()
x.f
16.0
N,L = np.shape(CleanImage)
HMatrix = []
for m in range(N):
line = CleanImage[m]
L = len(line)
A = np.fft.fft(line)
for k in range (L/2 + 1):
if k < (L * x.fPiezo * 0.2 / x.f):
A[k] = 0
A[-k] = 0
if k > (L * x.fPiezo *1.7 / x.f):
A[k] = 0
A[-k] = 0
CleanImage[m] = np.real(np.fft.ifft(A))
HMatrix.append(resample(np.abs(hilbert(CleanImage[m])),1000))
plt.plot(np.abs(A))
plt.show()
ProbeOffset = int(x.timings['t4'] *x.f / 1000)
CledImage = np.pad(CleanImage, ((0,0),(ProbeOffset,0)), 'constant')
HMatrixCld = np.pad(HMatrix, ((0,0),(ProbeOffset,0)), 'constant')
np.shape(HMatrix)
(365, 1000)
plt.figure(figsize = (15,15))
im = plt.imshow(np.sqrt(HMatrixCld), cmap='gray', aspect=1*(len(HMatrix[0])/len(HMatrix)), interpolation='nearest')
%%time
import cv2
CPU times: user 0 ns, sys: 0 ns, total: 0 ns
Wall time: 18.1 µs
n,l = np.shape(HMatrixCld)
print n,l
365 1560
%%time
maxRadius = l
print("maxRadius = {} pixels".format(maxRadius))
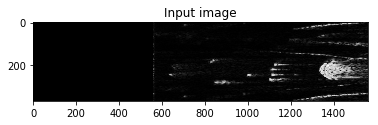
plt.imshow(HMatrixCld, cmap='gray')
plt.title("Input image")
plt.show()
angle_range = np.pi/2
theta_scale_factor = n / angle_range
print("{} rows per radian".format(theta_scale_factor))
theta_min = 3/2*np.pi - angle_range/2
theta_max = 3/2*np.pi + angle_range/2
print("theta: [{}, {}] radians".format(theta_min, theta_max))
pad_below = int(theta_min * theta_scale_factor)
pad_above = int((2*np.pi - theta_max) * theta_scale_factor)
print("Padding {} above and {} below".format(pad_above, pad_below))
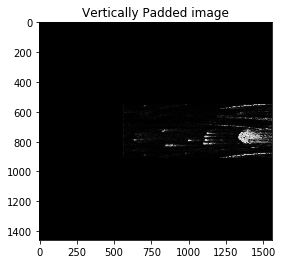
im_below = np.zeros((pad_below, maxRadius))
im_above = np.zeros((pad_above, maxRadius))
padded_image = np.vstack((im_above, HMatrixCld, im_below))
plt.imshow(padded_image, cmap='gray')
plt.title("Vertically Padded image")
plt.show()
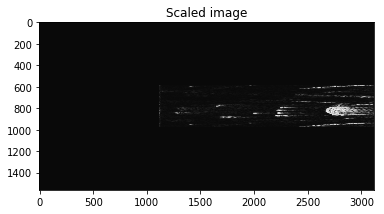
scaled_image = cv2.resize(padded_image, (2*maxRadius, maxRadius), interpolation=cv2.INTER_CUBIC)
plt.imshow(scaled_image, cmap='gray')
plt.title("Scaled image")
plt.show()
center = (int(scaled_image.shape[0]/2),int(scaled_image.shape[1])/2)
flags = cv2.WARP_INVERSE_MAP
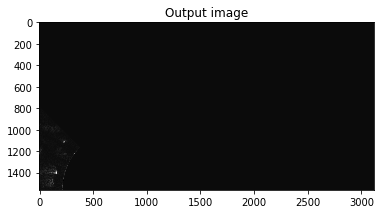
im_out = cv2.linearPolar(scaled_image, center, maxRadius, flags)
plt.imshow(im_out, cmap='gray')
plt.title("Output image")
plt.show()
maxRadius = 1560 pixels
232.366216914 rows per radian
theta: [2.35619449019, 3.92699081699] radians
Padding 547 above and 547 below
CPU times: user 2.52 s, sys: 2.68 s, total: 5.21 s
Wall time: 4.31 s
im_in = np.asarray(HMatrix)
im_in.shape[0]
365
maxRadius = im_in.shape[1]
print("maxRadius = {} pixels".format(maxRadius))
angle_range = np.pi/2
theta_scale_factor = im_in.shape[0] / angle_range
print("{} rows per radian".format(theta_scale_factor))
theta_min = 3/2*np.pi - angle_range/2
theta_max = 3/2*np.pi + angle_range/2
print("theta: [{}, {}] radians".format(theta_min, theta_max))
pad_below = int(0.5* theta_min * theta_scale_factor)
pad_above = int(0.5* (2*np.pi - theta_max) * theta_scale_factor)
print("Padding {} above and {} below".format(pad_above, pad_below))
im_below = np.zeros((pad_below, maxRadius), dtype='uint16')
im_above = np.zeros((pad_above, maxRadius), dtype='uint16')
padded_image = np.vstack((im_above, im_in, im_below))
scaled_image = cv2.resize(padded_image, (2*maxRadius, maxRadius), interpolation=cv2.INTER_CUBIC)
center = (int(scaled_image.shape[1]/2), 0)
flags = cv2.WARP_INVERSE_MAP
im_out = cv2.linearPolar(scaled_image, center, maxRadius, flags)
maxRadius = 1000 pixels
232.366216914 rows per radian
theta: [2.35619449019, 3.92699081699] radians
Padding 273 above and 273 below
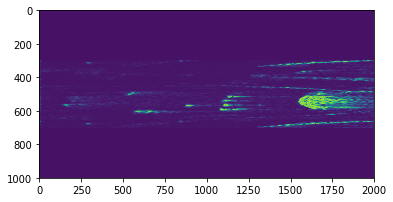
plt.imshow(scaled_image)
plt.show()
center = (2200, 500)
maxRadius = 2000
flags = cv2.WARP_INVERSE_MAP
dst = cv2.linearPolar(scaled_image, center, maxRadius, flags)
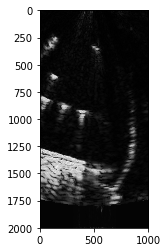
plt.imshow(np.flipud(np.transpose(dst)), cmap='gray')
<matplotlib.image.AxesImage at 0x7f21d4554d50>