20180812a - Let's see what we have
import spidev
import time
import numpy as np
import matplotlib
import matplotlib.pyplot as plt
import json
import time
from pyUn0 import *
for FILE in glob.glob("data/*.json"):
x = us_json()
x.JSONprocessing(FILE)
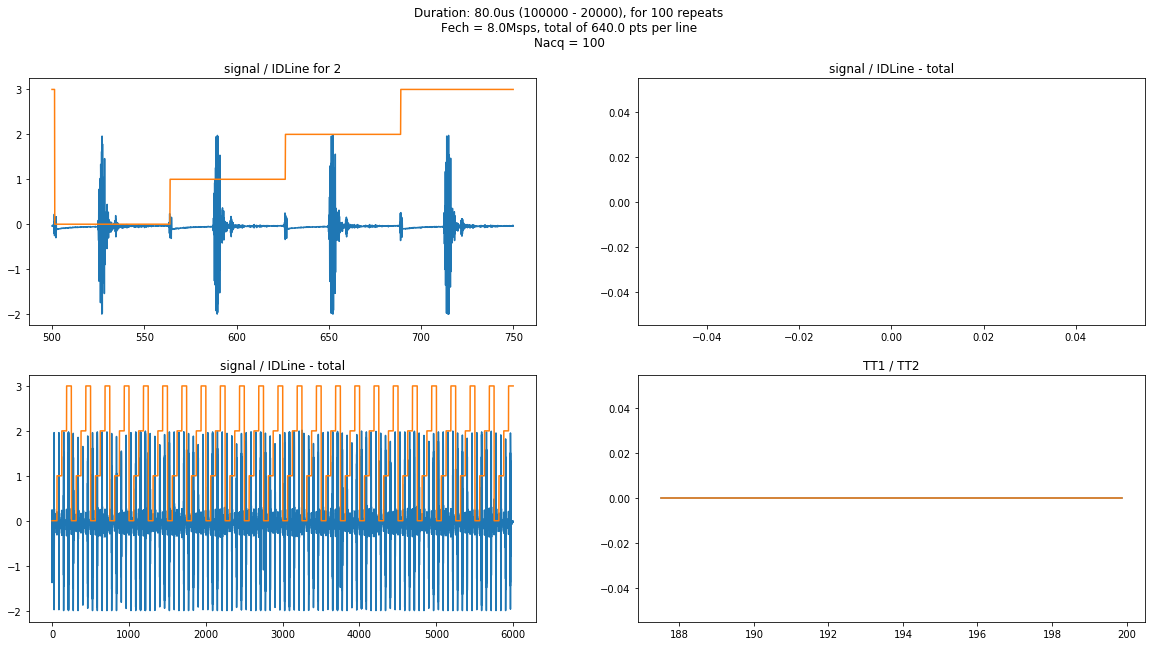
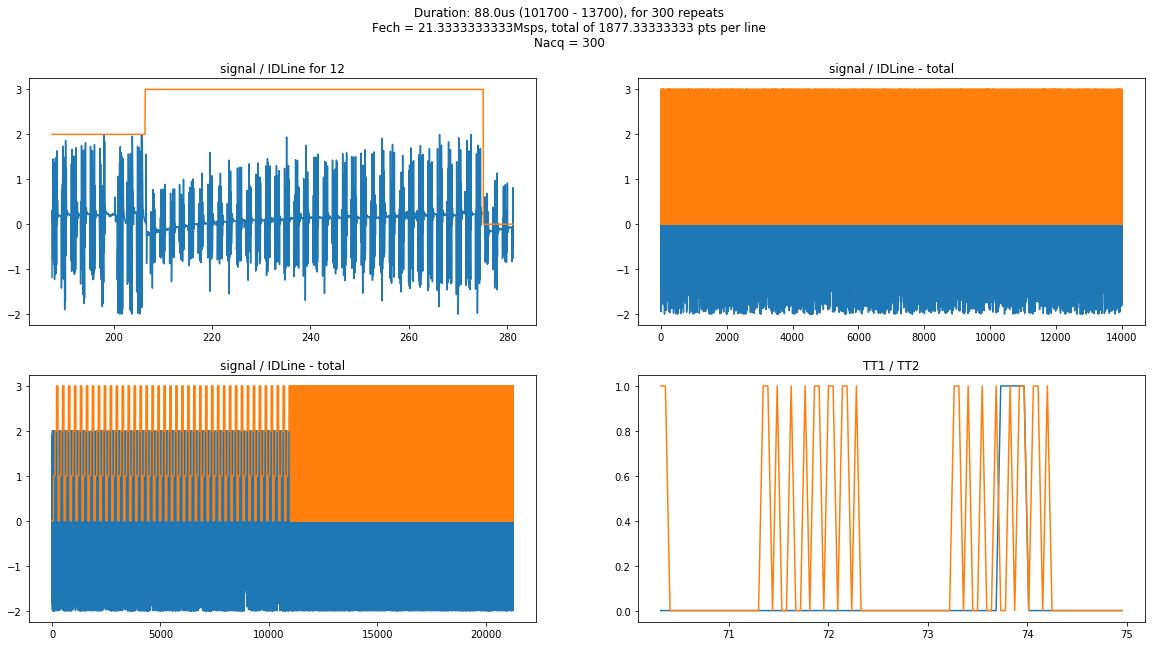
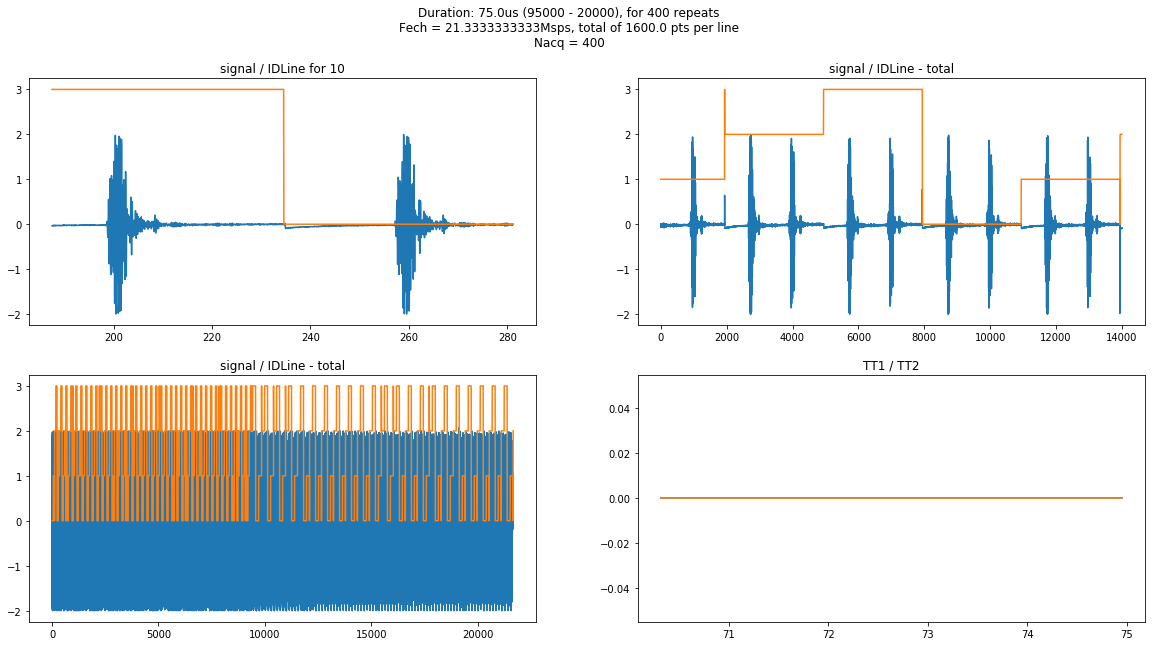
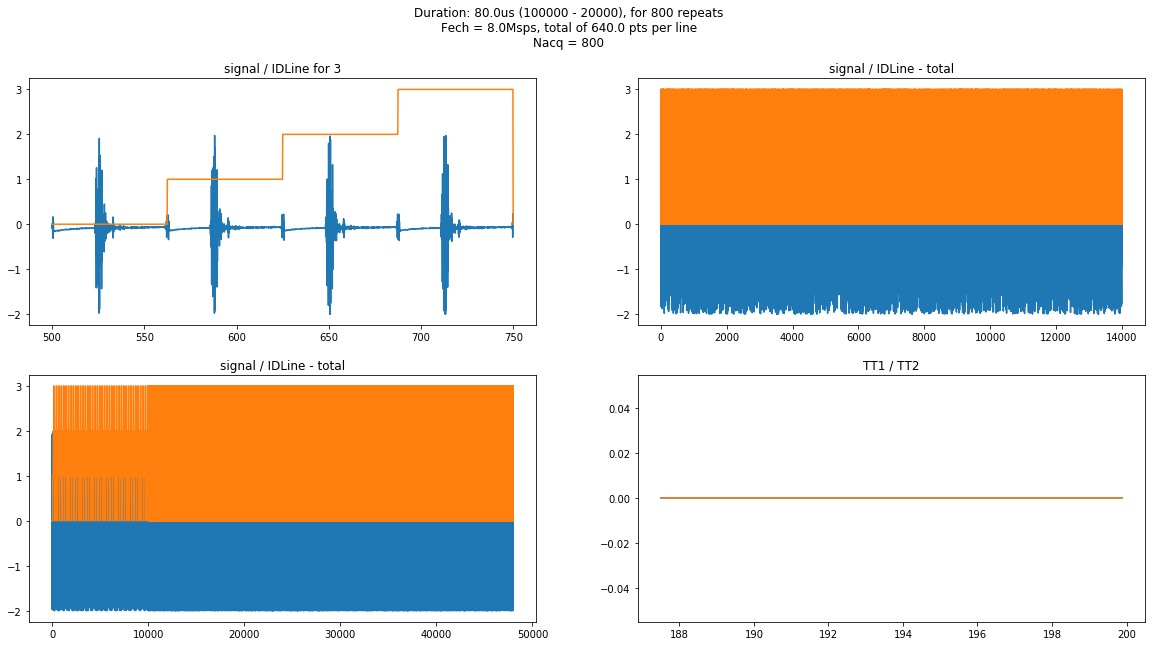
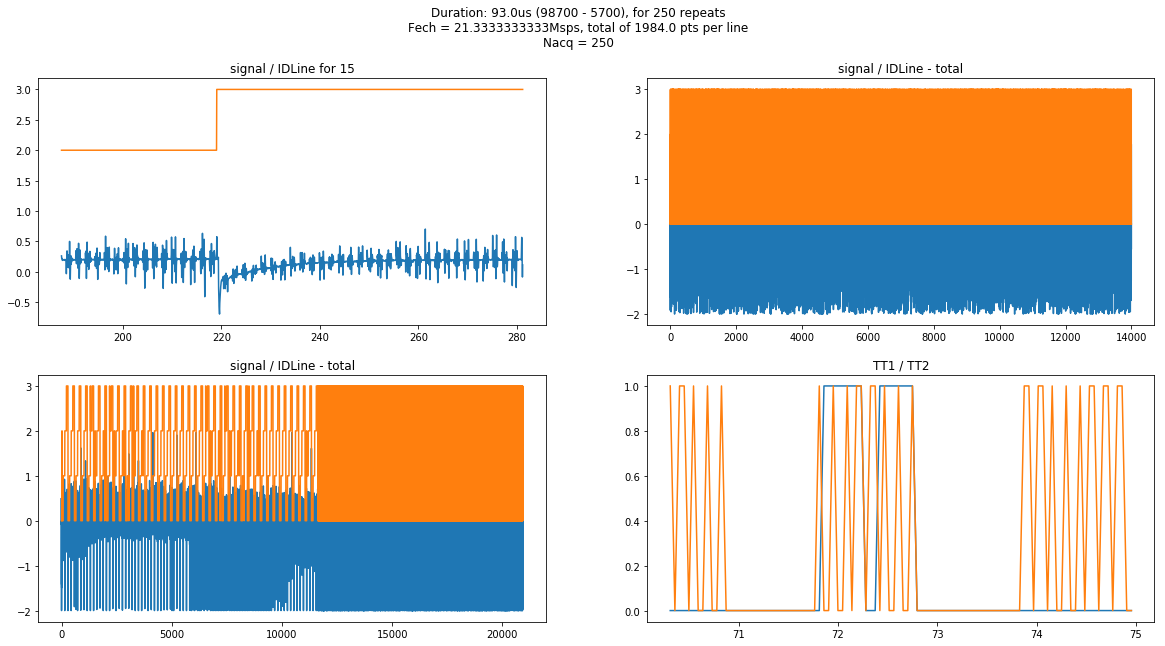
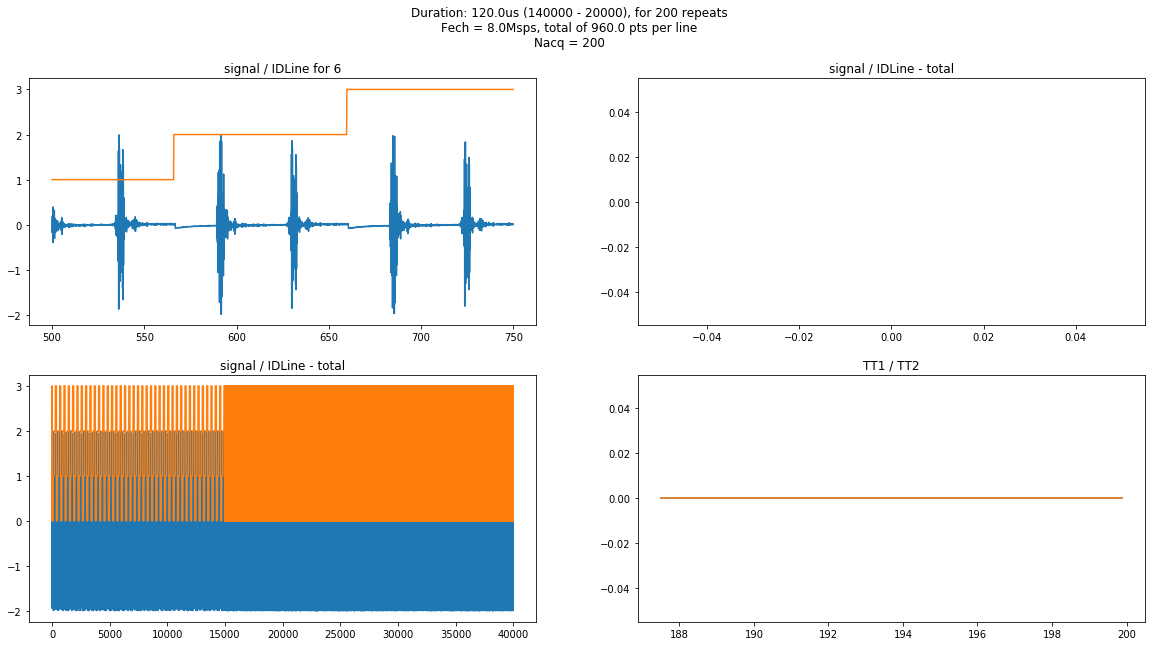
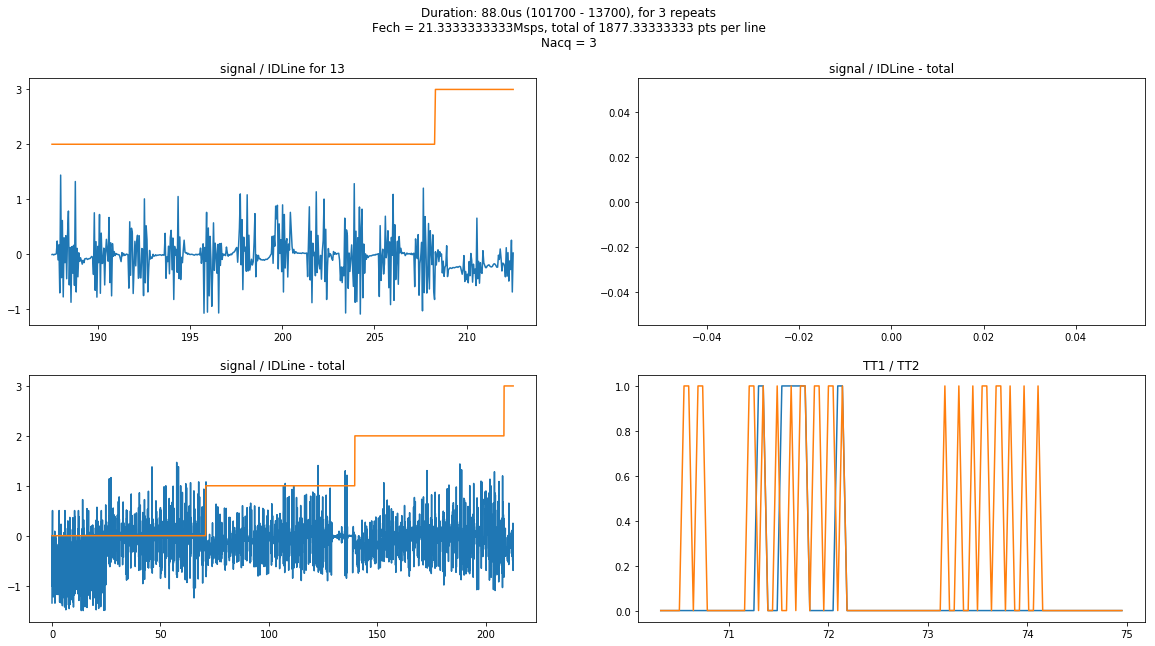
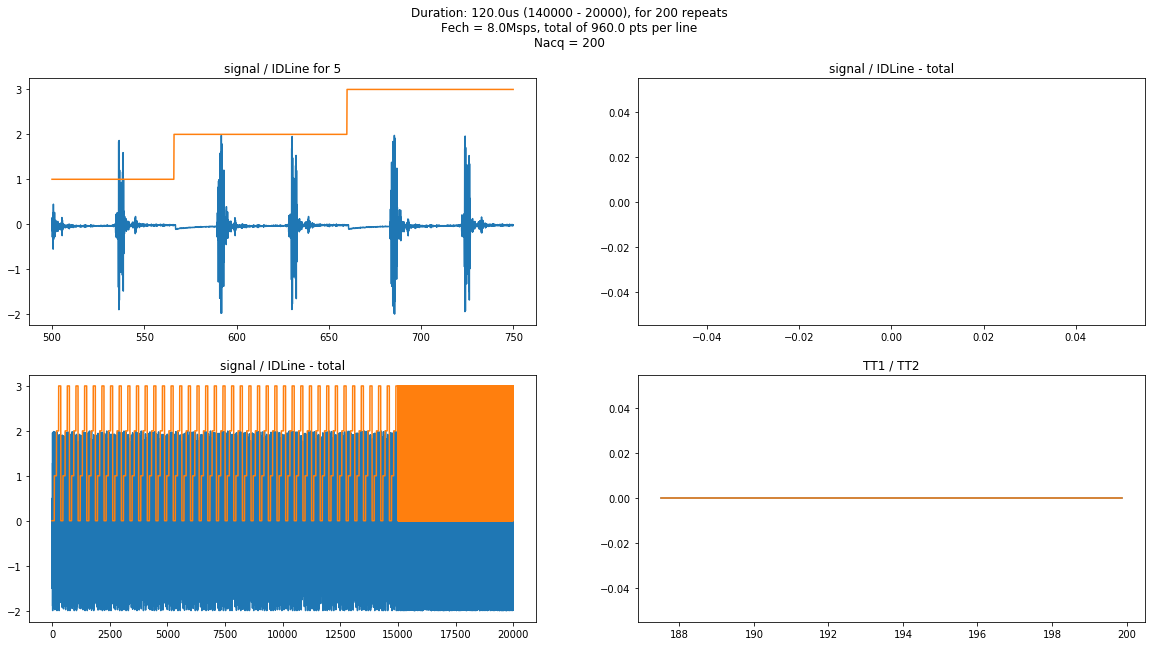
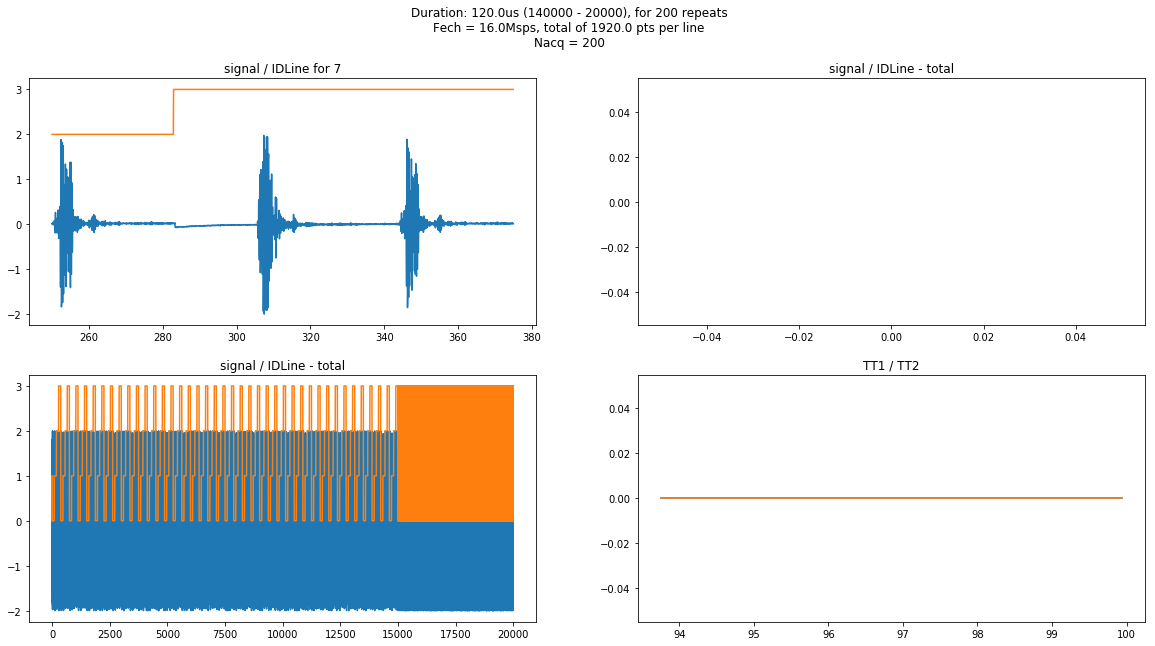
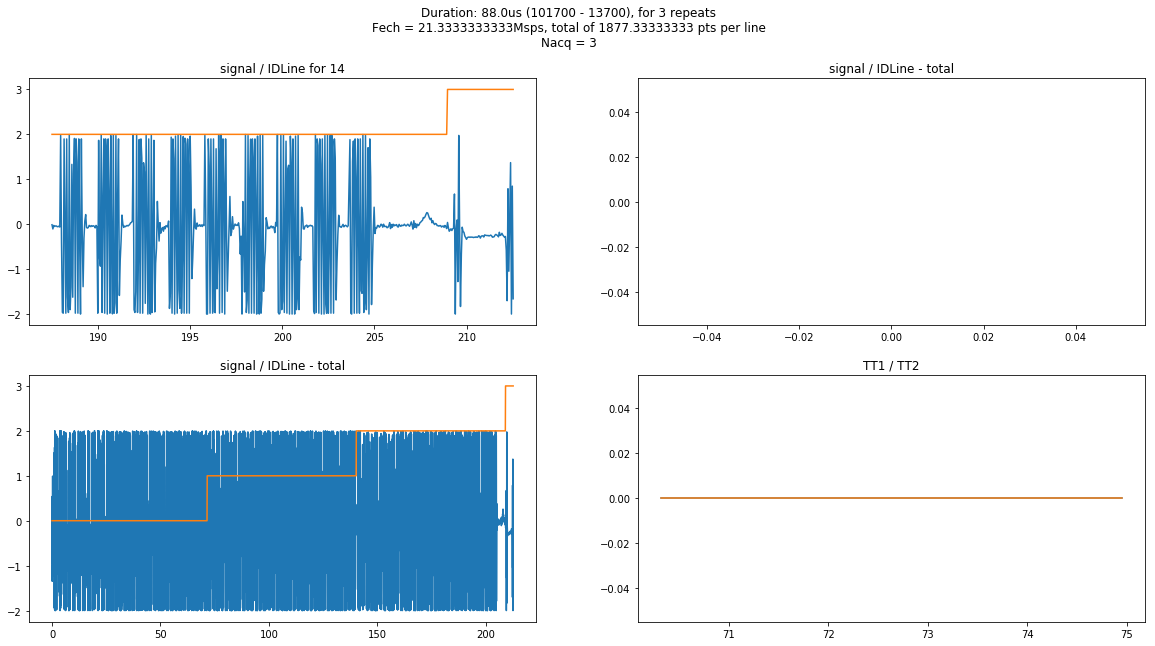
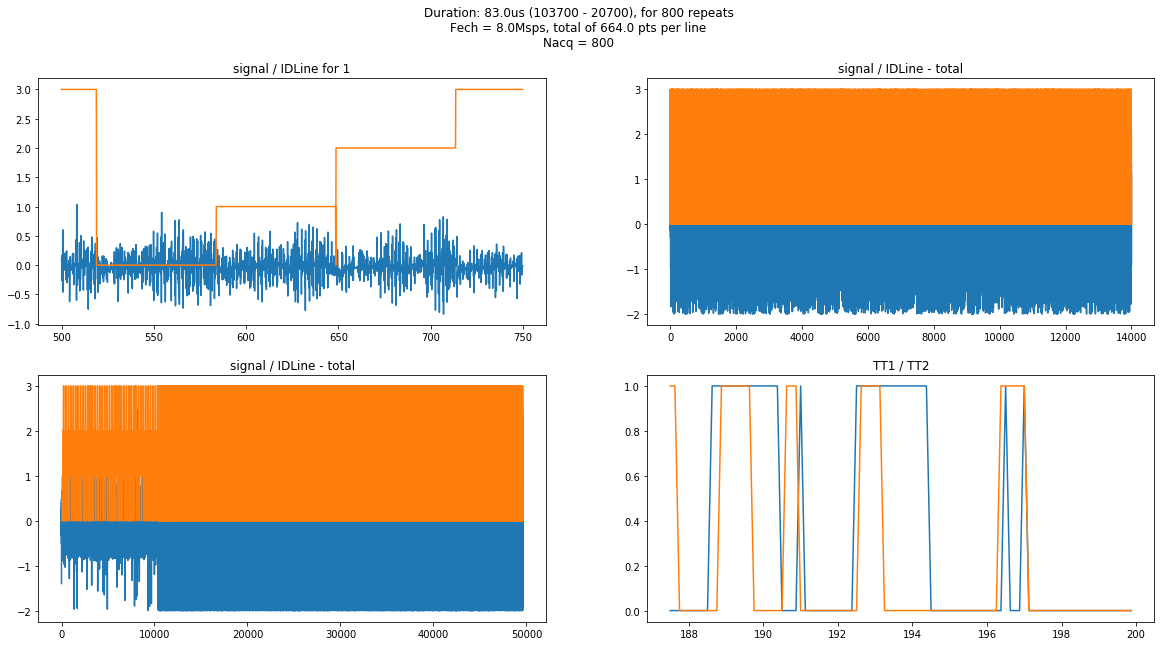
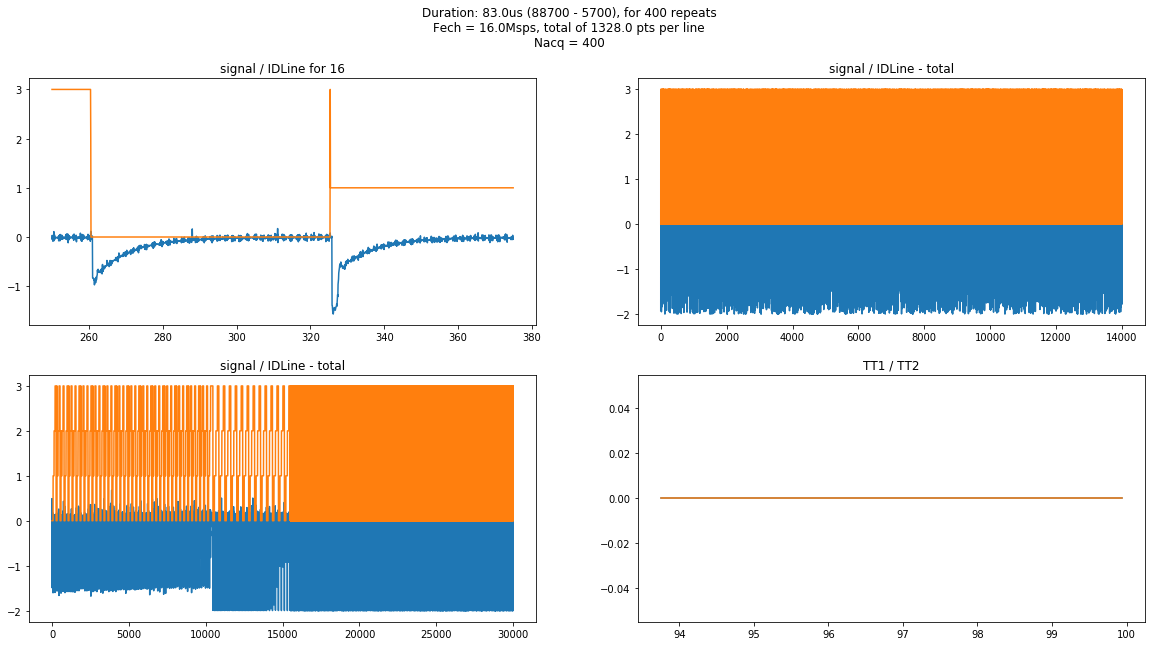
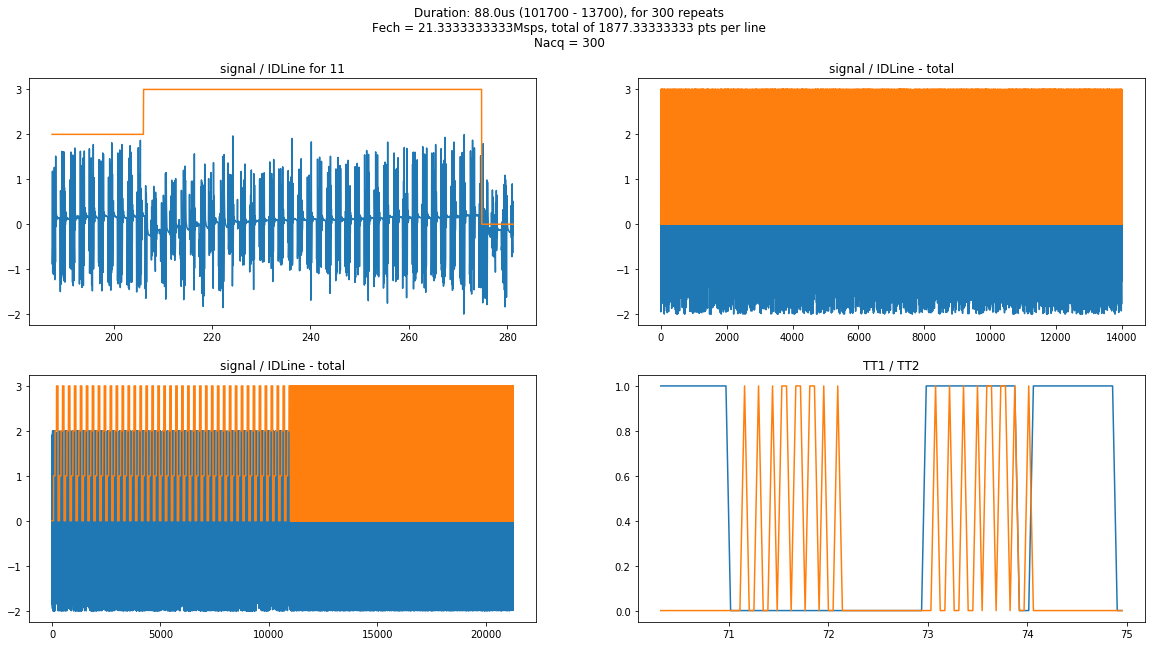
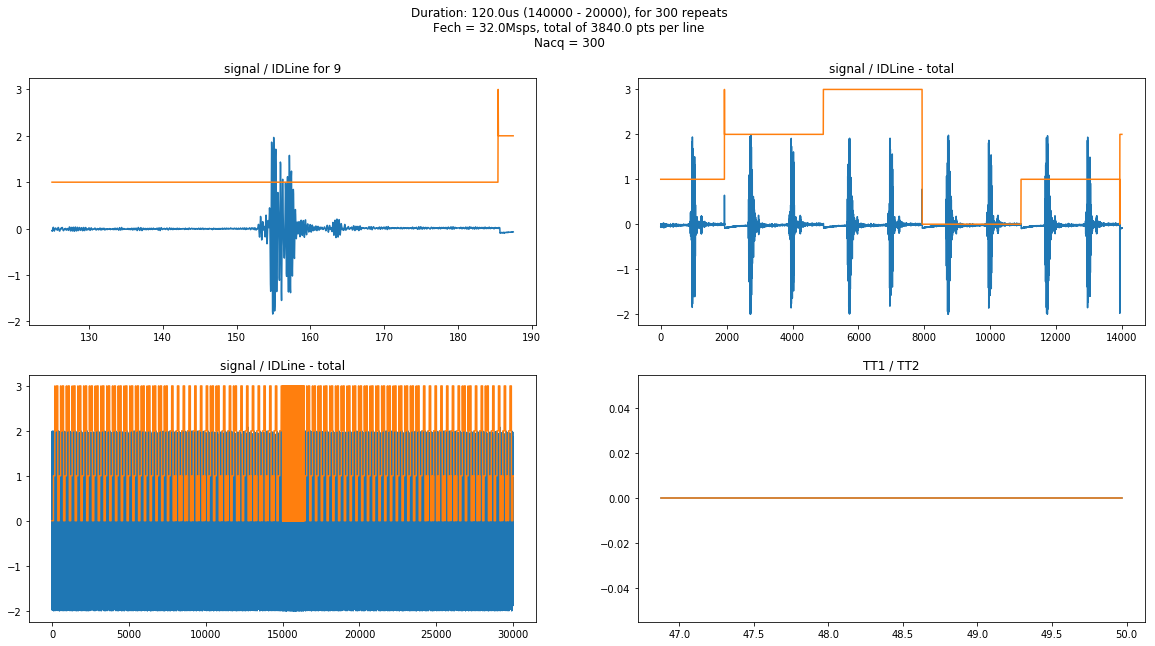
f, ((ax1, ax2), (ax3, ax4)) = plt.subplots(2, 2,figsize=(20,10))
Duration = (x.parameters['LengthAcq']-x.parameters['DeltaAcq'])/1000.0
Title = "Duration: "+str(Duration)+"us ("+str(x.parameters['LengthAcq'])+" - "
Title+= str(x.parameters['DeltaAcq'])+"), for "+str(x.Nacq)
Title += " repeats\n"
Title += "Fech = "+str(x.f)+"Msps, total of "+str(float(x.f)*Duration)+" pts per line\n"
Title += "Nacq = "+str(x.Nacq)
plt.suptitle(Title)
A = 4000
B = 6000
ax1.plot(x.t[A:B],x.tmp[A:B])
ax1.plot(x.t[A:B],x.IDLine[A:B])
ax1.set_title('signal / IDLine for '+str(x.N))
A =340000
ax2.plot(x.tmp[A:A+14000])
ax2.plot(x.IDLine[A:A+14000])
ax2.set_title('signal / IDLine - total')
ax3.plot(x.t,x.tmp)
ax3.plot(x.t,x.IDLine)
ax3.set_title('signal / IDLine - total')
ax4.plot(x.t[1500:1600],x.TT1[1500:1600])
ax4.plot(x.t[1500:1600],x.TT2[1500:1600])
ax4.set_title('TT1 / TT2')
plt.show()
FileName = "images/"+x.iD+"-"+str(x.N)+"-all.jpg"
f.savefig(FileName)
Data acquired
Data acquired
Data acquired
Data acquired
Data acquired
Data acquired
Data acquired
Data acquired
Data acquired
Data acquired
Data acquired
Data acquired
Data acquired
Data acquired
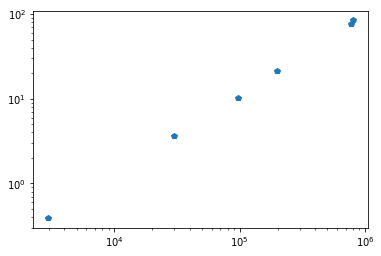
Seems it takes 1s for 10000 transfers
NAcqs = [198401,793601,2977,29761,96001,768000]
Duration = [21.04,84,0.39,3.64,10.22,77]
plt.loglog(NAcqs,Duration,"p")
plt.show()