20180511a - Enveloppe detection tests
import numpy as np
import matplotlib.pyplot as plt
from scipy import signal
from scipy.interpolate import griddata
import math
from scipy.signal import decimate, convolve
import json
import re
import glob, os
Let's open an image
This should be a 60 lines scan of the wirephantom. Let's check it.
npz = np.load("../20180430a/wire/dataset.npz")
image = npz["arr_1"]

with open('../20180430a/wire/p_servo-23.json') as json_data:
    d = json.load(json_data)
    print d.keys()
[u'firmware_md5', u'target', u'parameters', u'registers', u'position', u'firmware_version', u'data']
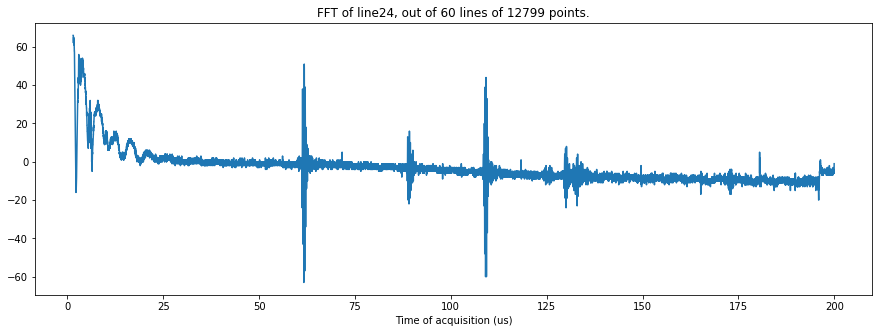
TestLine = 24
plt.figure(figsize=(15,5))
N,L = np.shape(image)
t = [ x/64.0 for x in range(L)]
plt.plot(t[100:],image[TestLine][100:])
plt.xlabel("Time of acquisition (us)")
plt.title("FFT of line"+str(TestLine)+", out of "+str(N)+" lines of "+str(L)+" points.")
plt.show()
DAC = [ int(x) for x in d['registers'].keys() if int(x) < 200]
DAC.sort()
DACValues = [d['registers'][str(key)] for key in DAC]
print DACValues,len(DAC)
[25, 26, 28, 30, 32, 34, 36, 38, 40, 41, 43, 45, 47, 49, 51, 53, 55, 56, 58, 60, 62, 64, 66, 68, 70, 71, 73, 75, 77, 79, 81, 83, 85, 86, 88, 90, 92, 94, 96, 0, 0] 41
rawSig = image[TestLine]

FFT = np.fft.fft(rawSig)
FFTCleaned = np.fft.fft(rawSig)
FFTLow = np.fft.fft(rawSig)

FStart = 0.068*len(FFTCleaned)*0.7
FStop = 0.196*len(FFTCleaned)*0.5

for k in range(len(FFTCleaned)/2 +1):
    if (k < FStart or k > FStop): # in (k < 550000 or k > 790000) # 0.068 0.196
        FFTCleaned[k] = 0
        FFTCleaned[-k] = 0
    if k < 100:
        FFTLow[k] = 0
        FFTLow[-k] = 0

Scale = max(FFT)
ff = [ 64*2.0*x/(2*len(rawSig)) for x in range(len(rawSig)/2)]

plt.figure(figsize=(15,5))
plt.plot(ff[len(FFT)/35:len(FFT)/2],np.abs(FFT)[len(FFT)/35:len(FFT)/2]/Scale,"b")
plt.plot(ff[len(FFT)/35:len(FFT)/2],np.abs(FFTLow)[len(FFT)/35:len(FFT)/2]/Scale,"r")
plt.plot(ff[len(FFT)/35:len(FFT)/2],np.abs(FFTCleaned)[len(FFT)/35:len(FFT)/2]/Scale,"y")
plt.title("Details of the FFT - line "+str(TestLine)+".")
plt.xlabel("Frequency (MHz)")
plt.savefig("fft"+str(TestLine)+".jpg", bbox_inches='tight')
plt.show()
F = np.real(np.fft.ifft(FFTCleaned))
FL = np.real(np.fft.ifft(FFTLow))
FH = np.asarray(np.abs(signal.hilbert(F)))
#plt.figure()
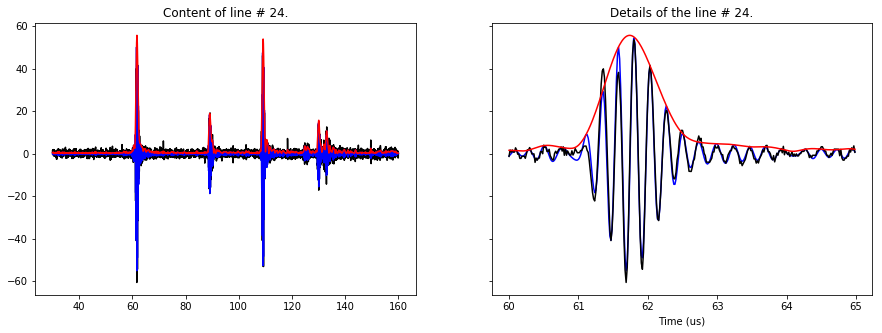
f, (ax1, ax2) = plt.subplots(1, 2, sharey=True, figsize=(15,5))
t1 = 30*64
t2 = 160*64
T1 = 60*64
T2 = 65*64
ax1.plot(t[t1:t2],FL[t1:t2],"k")
ax1.plot(t[t1:t2],F[t1:t2],"b")
ax1.plot(t[t1:t2],FH[t1:t2],"r")
ax1.set_title("Content of line # "+str(TestLine)+".")
ax2.plot(t[T1:T2],F[T1:T2],"b")
ax2.plot(t[T1:T2],FL[T1:T2],"k")
ax2.plot(t[T1:T2],FH[T1:T2],"r")
ax2.set_title("Details of the line # "+str(TestLine)+".")
plt.xlabel("Time (us)")
plt.savefig("detail_line_"+str(TestLine)+".jpg", bbox_inches='tight')
plt.show()
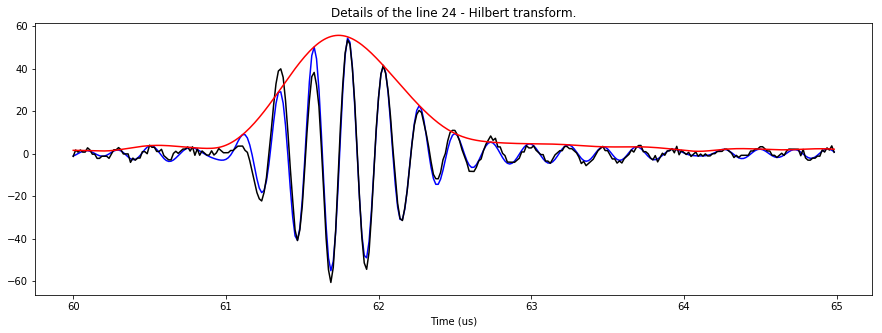
plt.figure(figsize=(15,5))

plt.plot(t[T1:T2],F[T1:T2],"b")
plt.plot(t[T1:T2],FL[T1:T2],"k")
plt.plot(t[T1:T2],FH[T1:T2],"r")

plt.title("Details of the line "+str(TestLine)+" - Hilbert transform.")
plt.xlabel("Time (us)")

plt.savefig("env_hilbert_"+str(TestLine)+".jpg", bbox_inches='tight')
plt.show()
Testing other enveloppe detection
l = 5
mm = []
for k in range(L-l):
    mm.append(np.max(abs(FL[k:k+l]))  )
plt.figure(figsize=(15,5))
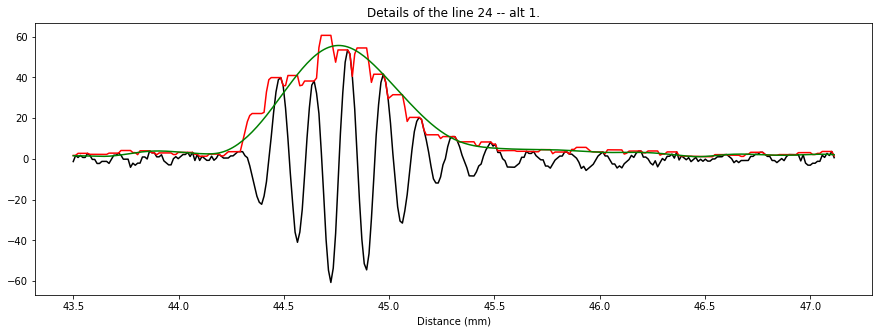
cm = []
for i in range(len(t)):
cm.append(t[i]*0.725)
plt.plot(cm[T1:T2],FL[T1:T2],"k")
plt.plot(cm[T1:T2],mm[T1:T2],"r")
plt.plot(cm[T1:T2],FH[T1:T2],"g")
plt.title("Details of the line "+str(TestLine)+" -- alt 1.")
plt.xlabel("Distance (mm)")
plt.savefig("env_alt1_"+str(TestLine)+".jpg", bbox_inches='tight')
plt.show()