20180721a - Tests for TGC and pyUn0
import numpy as np
import matplotlib.pyplot as plt
from scipy import signal
from scipy.interpolate import griddata
import math
from scipy.signal import decimate, convolve
import json
import re
import glob, os
import sys
import pyexiv2
import os
from pyUn0 import *
Not loading RPi.GPIO as not on RPi
Creating the set of acquisitions
DataSet = {}

for data in glob.glob("data/*.json"):
    print data
    x = us_json()
    x.JSONprocessing(data)
    x.mkImg()
    x.PlotDetail(0,100,125)
    #x.SaveNPZ()
    print x.Nacq
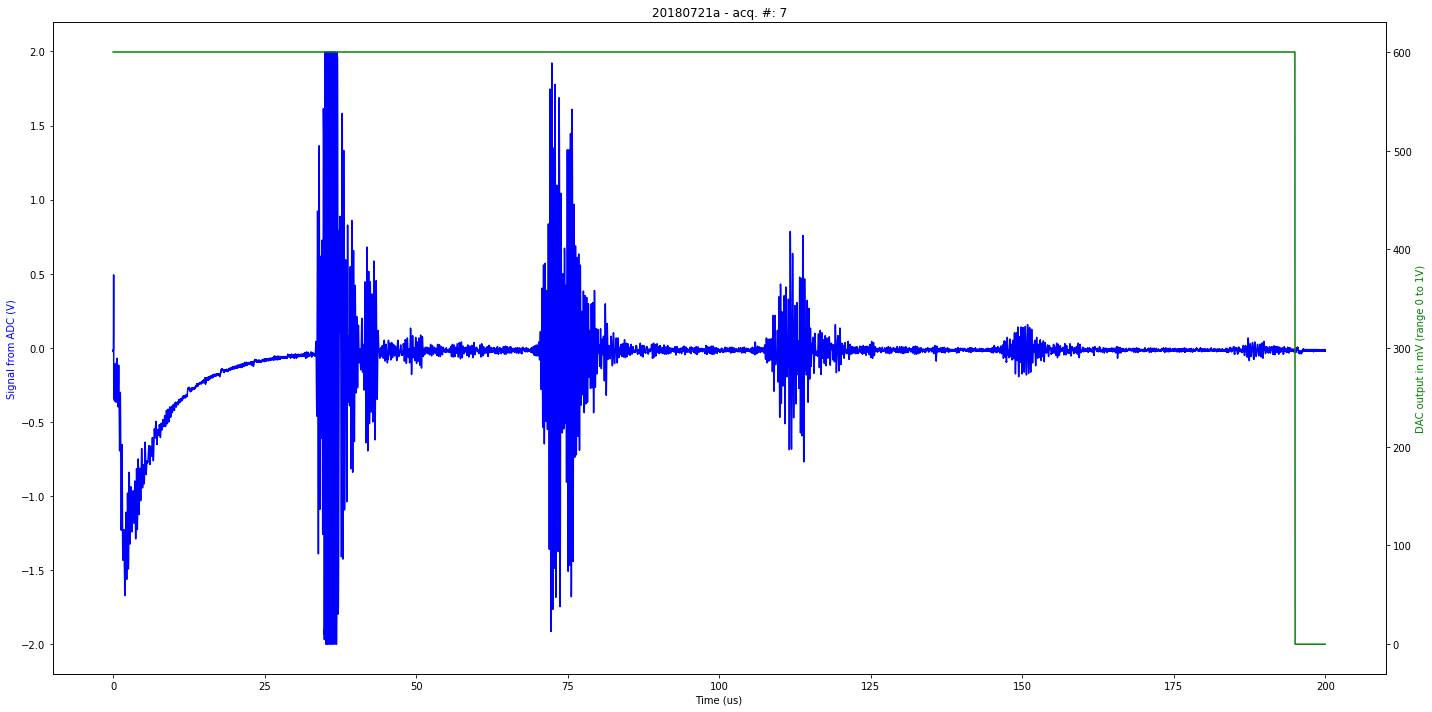
data/20180721a-7.json

51
data/20180721a-1.json


51
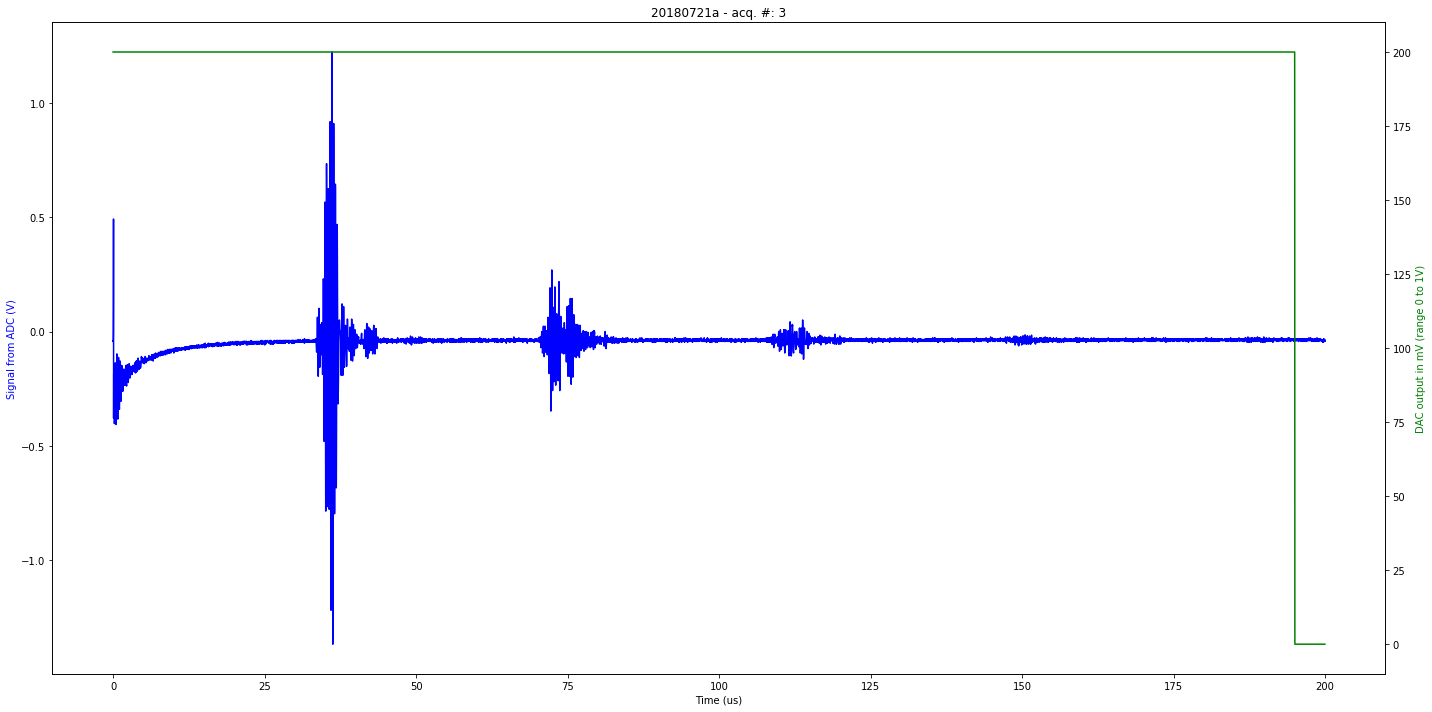
data/20180721a-3.json

51
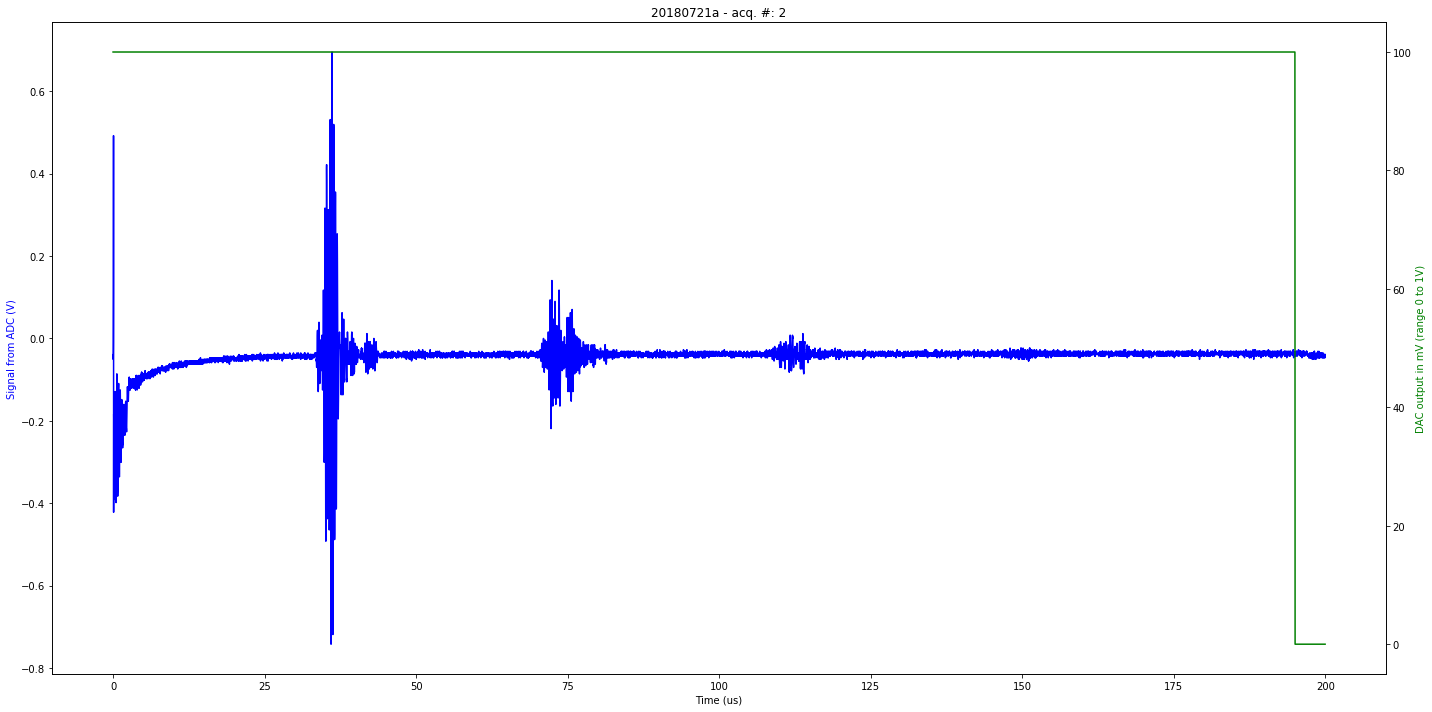
data/20180721a-2.json

51
data/20180721a-11.json
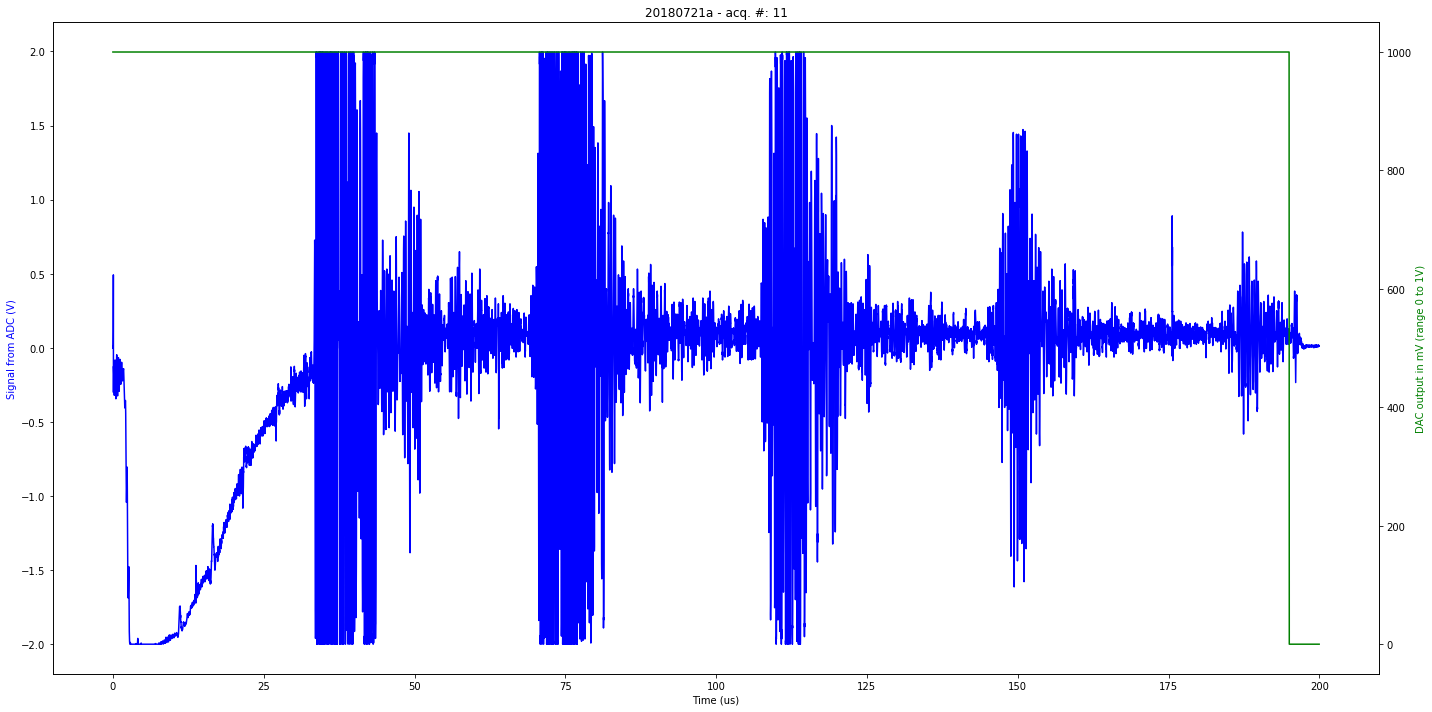

51
data/20180721a-6.json


51
data/20180721a-9.json
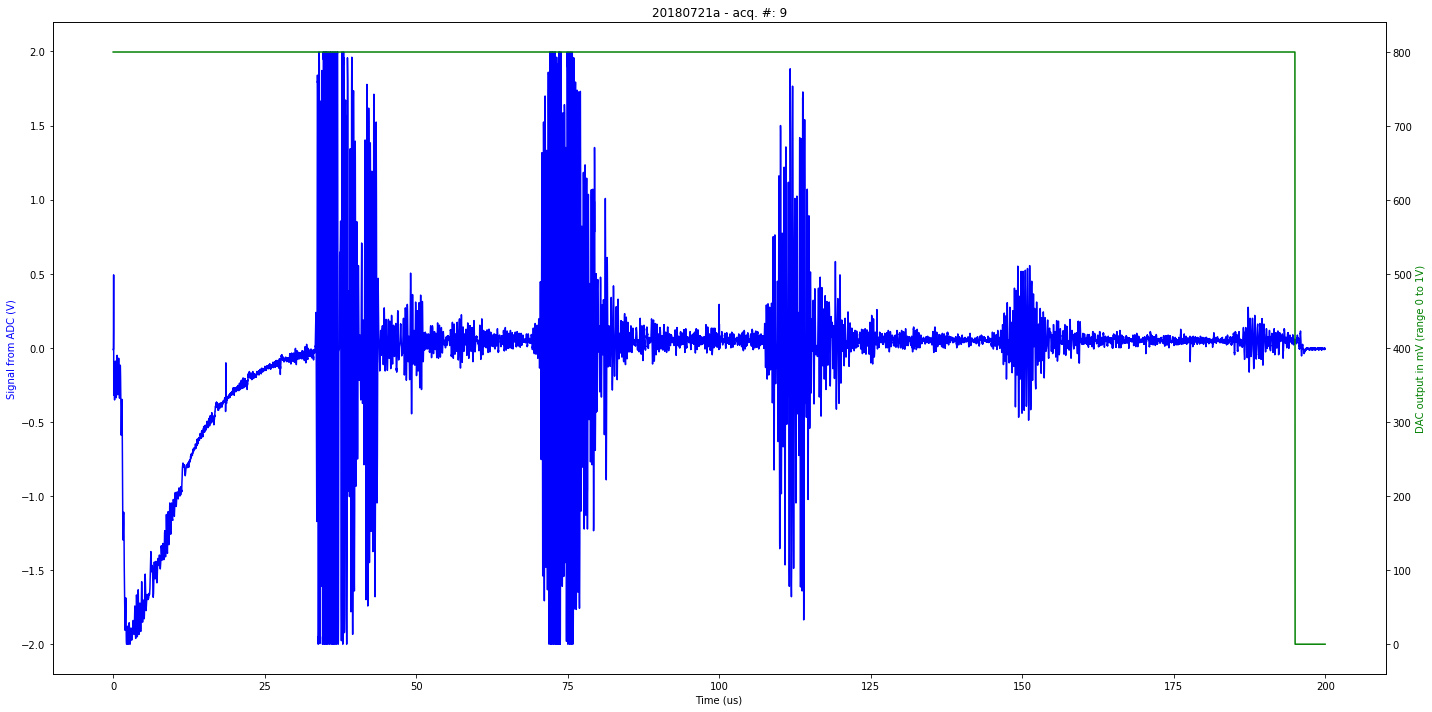

51
data/20180721a-5.json
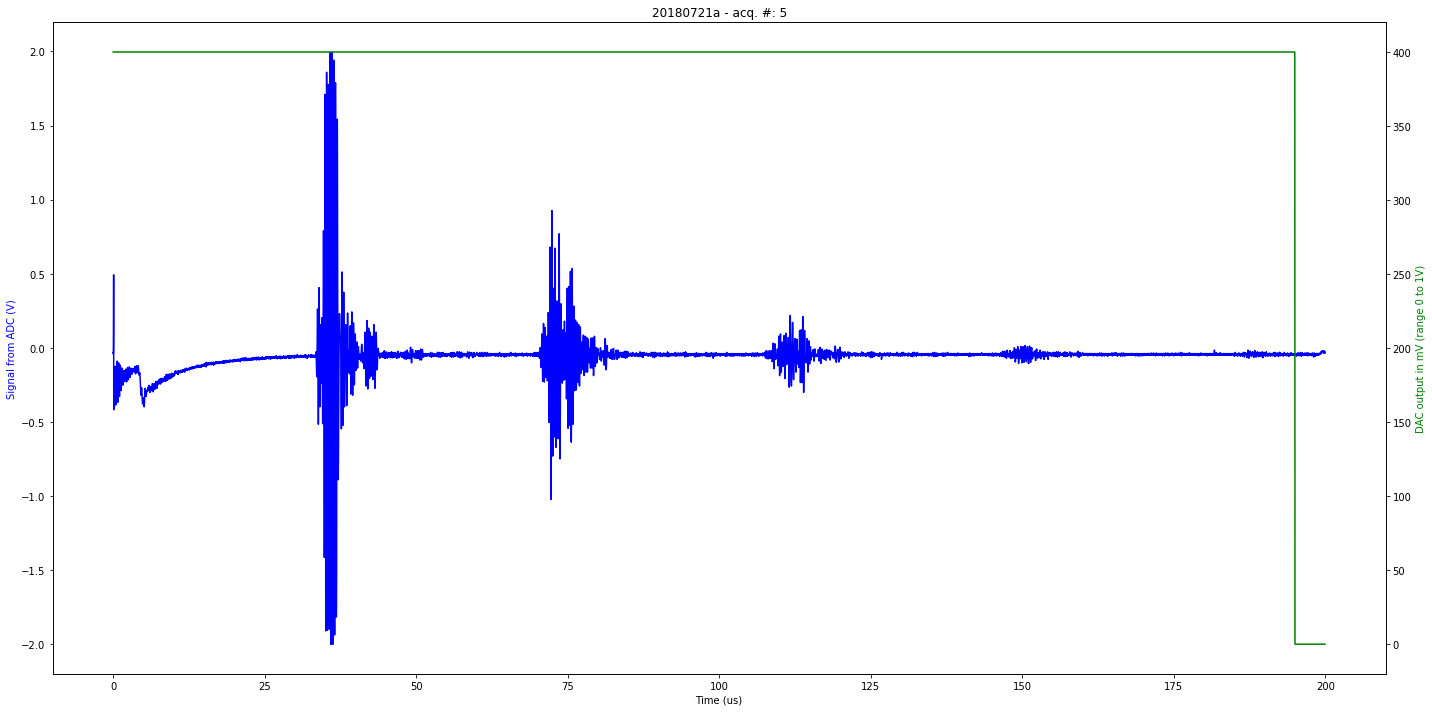

51
data/20180721a-4.json
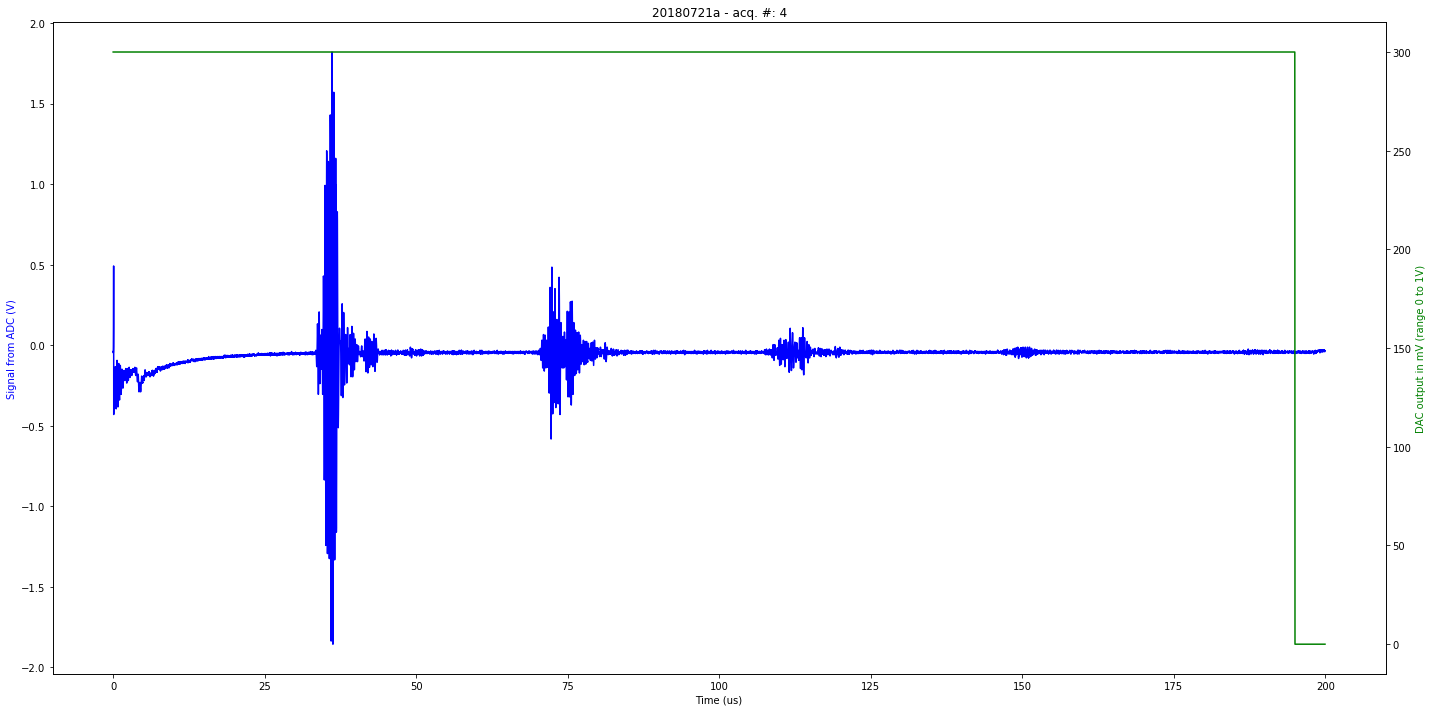

51
data/20180721a-12.json


51
data/20180721a-8.json
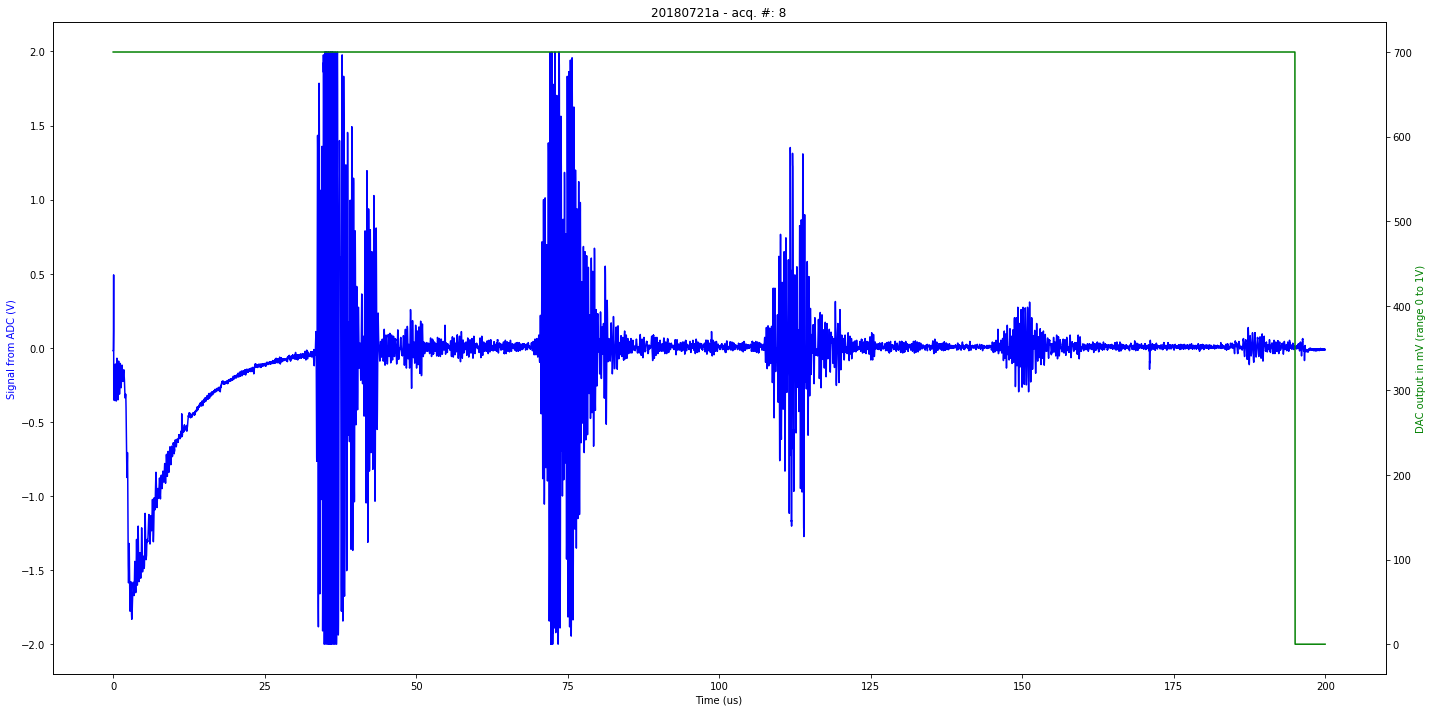

51
data/20180721a-10.json


51
Let's compare two series, with two different gain values
x = us_json()
x.JSONprocessing("data/20180721a-1.json")
y = us_json()
y.JSONprocessing("data/20180721a-7.json")
print y
<pyUn0.us_json instance at 0x7ff828e79ef0>
A = 115
B = 122
Dist = [ np.linalg.norm(0.1*k*x.EnvHil[64*A:64*B]-y.EnvHil[64*A:64*B]) for k in range(500)]
Amp = np.argmin(Dist)*0.1
print Amp
23.2
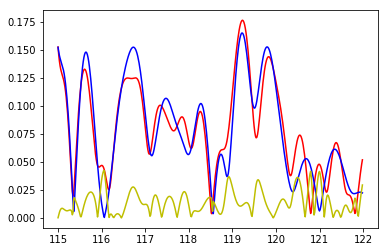
Fitting the good gain value
plt.plot(x.t[64*A:64*B],Amp*x.EnvHil[64*A:64*B],"r")
plt.plot(y.t[64*A:64*B],    y.EnvHil[64*A:64*B],"b")
plt.plot(y.t[64*A:64*B],abs(Amp*x.EnvHil[64*A:64*B]-y.EnvHil[64*A:64*B]),"y")
plt.show()
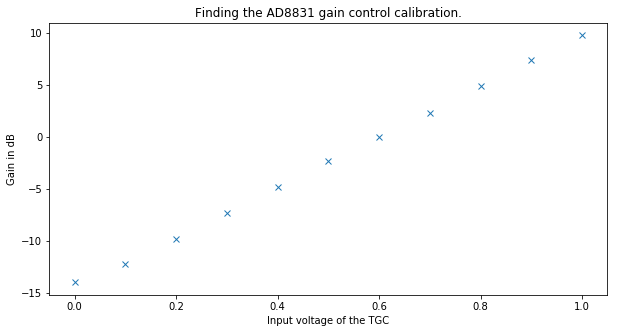
Finding the gain relationship
AD8331: Gain ranges from 7.5dB to 55.5dB
TGC = {}
x = us_json()
x.JSONprocessing("data/20180721a-7.json")
x.tdac[3]
TGC[x.tdac[3]] = {}

for data in glob.glob("data/*.json"):
    #print data
    y=  us_json()
    y.JSONprocessing(data)
    A = 115
    B = 122
    Dist = [ np.linalg.norm(0.005*k*x.EnvHil[64*A:64*B]-y.EnvHil[64*A:64*B]) for k in range(6000)]
    Amp = np.argmin(Dist)*0.005
    TGC[x.tdac[3]][y.tdac[3]] = Amp
    print y.tdac[3],Amp
600.0 1.0
0.0 0.04
200.0 0.105
100.0 0.06
1000.0 9.42
500.0 0.585
800.0 3.08
400.0 0.33
300.0 0.185
0.0 0.04
700.0 1.71
900.0 5.41
for i in TGC.keys():
    X = [x/1000.0 for x in TGC[i].keys()]
    Y = [TGC[i][k] for k in TGC[i].keys()]
    plt.figure(figsize=(10,5))
    #plt.semilogy(X,Y,"x")
    plt.plot(X,10.0*np.log10(Y),"x")
    plt.xlabel("Input voltage of the TGC")
    plt.ylabel("Gain in dB")
    Title = "Finding the AD8831 gain control calibration."
    plt.title(Title)
    ImagePath = "images/gain_comparison_to_"+str(i)+".jpg"
    plt.savefig(ImagePath)
    TagImage(ImagePath,"matty","20180721a","calibration",Title)
    plt.show()
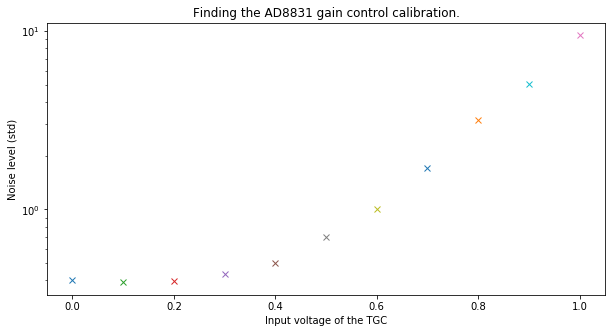
Let's check noise level check
noise = {}
A = 100
B = 105
for data in glob.glob("data/*.json"):
    #print data
    y=  us_json()
    y.JSONprocessing(data)
    npstd = np.std(y.tmp[64*A:64*B])
    noise[y.tdac[3]] = npstd
    print y.tdac[3],npstd
600.0 0.00869620544291
0.0 0.00343666413288
200.0 0.00344497907413
100.0 0.0033915122493
1000.0 0.0821853461908
500.0 0.00605743099937
800.0 0.0276836091832
400.0 0.0043617893766
300.0 0.00379196842097
0.0 0.00350269482955
700.0 0.0148713307383
900.0 0.0440806293391
plt.figure(figsize=(10,5))
for i in noise.keys():
    xx = i/1000.0
    yy = noise[i]/noise[600]

    plt.semilogy(xx,yy,"x")
    #plt.plot(X,Y,"x")
plt.xlabel("Input voltage of the TGC")
plt.ylabel("Noise level (std)")
Title = "Finding the AD8831 gain control calibration."
plt.title(Title)
ImagePath = "images/gain_noise_comparison_to_"+str(600)+".jpg"
plt.savefig(ImagePath)
TagImage(ImagePath,"matty","20180721a","calibration",Title)
plt.show()
